Jan 22, 2026

You have run your mass spectrometry experiment. The data looks good. But something strange appears in your results. Your peptide false discovery rate sits at 5%. Yet your protein FDR reads only 0.8%. How can proteins have fewer errors when they are built from peptides? This paradox confuses researchers daily.
It should not.
The relationship between peptide and protein false discovery rates follows predictable statistical patterns. Understanding these patterns transforms confusion into clarity. It separates experienced proteomics researchers from beginners struggling to interpret their data. And it determines whether your published results will withstand scrutiny or crumble under replication attempts.
This guide explains the counterintuitive mathematics behind FDR at different levels of peptide analysis. You will learn exactly why a high peptide FDR can produce a low protein FDR, how target-decoy strategies work at each level, and what this means for your research quality. Whether you use MaxQuant, Proteome Discoverer, or custom analysis pipelines, these principles apply universally to shotgun proteomics experiments. SeekPeptides provides comprehensive resources for understanding peptide science at every level, from basic identification to advanced analytical techniques that power modern proteomics research.
Understanding false discovery rate fundamentals
False discovery rate measures the proportion of incorrect identifications among all reported results. In proteomics, this means estimating how many of your identified peptides or proteins are actually wrong. The concept sounds simple enough. A 1% FDR means roughly one in every hundred identifications is incorrect.
But simplicity deceives.
FDR operates differently at peptide and protein levels because the underlying statistical problems differ fundamentally. A peptide identification comes from matching a mass spectrum to a theoretical peptide sequence. A protein identification requires assembling multiple peptide matches and inferring which proteins were actually present in your sample. These are distinct statistical challenges with different error modes.
The mass spectrometer fragments peptide molecules and records their fragment ion patterns. Search algorithms then compare these experimental spectra against theoretical fragmentation patterns calculated from protein sequence databases. Each comparison generates a score reflecting how well the experimental spectrum matches the theoretical prediction. Higher scores suggest better matches, but every search produces some high-scoring matches by pure chance.
Random matches happen because databases contain millions of potential peptide sequences, and experimental spectra are imperfect. Noise, missing ions, and chemical modifications create situations where incorrect peptides occasionally score well against spectra they did not actually produce. Without proper statistical controls, these false matches contaminate your results and lead to incorrect biological conclusions.
The peptide-spectrum match foundation
Every proteomics experiment begins with peptide-spectrum matches, often abbreviated as PSMs. A single spectrum gets matched against all peptides in your database, and the search engine reports the best-scoring match. This creates the foundation upon which all higher-level identifications build.
Consider what happens during a typical search. Your mass spectrometer acquires 50,000 MS/MS spectra during a two-hour run. The search engine compares each spectrum against perhaps 500,000 potential peptide sequences from your protein database. This means 25 billion comparisons for a single experiment. With numbers this large, high-scoring random matches become inevitable.
Statistical methods must distinguish true matches from these random high-scorers. The target-decoy approach, which we will examine in detail, provides the dominant solution in modern proteomics. It works by estimating how often random matches occur and using this estimate to filter results appropriately.
Understanding PSM-level statistics is essential because errors at this level propagate upward. False peptide identifications can contribute to false protein identifications. However, the relationship is not straightforward, which brings us to the central puzzle this guide addresses.
Different levels of identification
Proteomics operates at three distinct identification levels, each with its own FDR considerations. The levels build upon each other but have different statistical properties.
PSM level represents individual spectrum-to-peptide matches. One spectrum yields one PSM. If the same peptide gets identified from ten different spectra, that counts as ten PSMs. FDR at this level measures the proportion of incorrect spectrum assignments among all reported PSMs.
Peptide level collapses redundant PSMs. If ten spectra all match the same peptide sequence, that counts as one peptide identification. FDR at this level measures the proportion of incorrectly identified unique peptide sequences. Peptide-level FDR is typically lower than PSM-level FDR because multiple PSMs supporting the same peptide provide additional confidence.
Protein level assembles peptides into protein identifications. Multiple peptides map to each protein, though some peptides are shared between multiple proteins. FDR at this level measures the proportion of incorrectly inferred proteins. This level introduces additional complexity because protein inference is not a simple summation of peptide evidence.
The key insight is that these levels are not independent. Errors at lower levels propagate upward, but they do not propagate equally for true and false identifications. This asymmetry explains why high peptide FDR can coexist with low protein FDR.
The target-decoy strategy explained
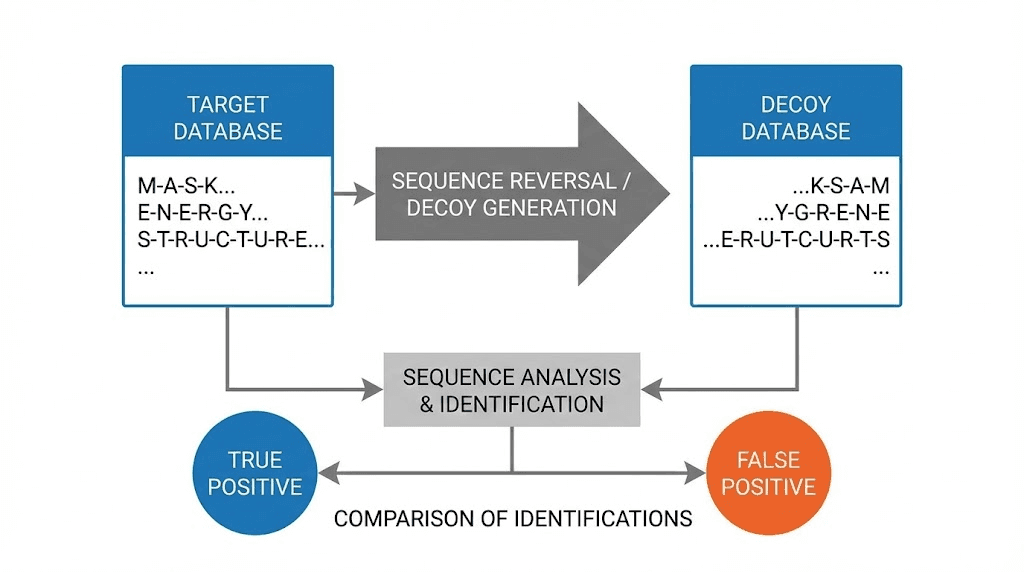
The target-decoy approach dominates FDR estimation in proteomics because it provides a practical, assumption-light method for estimating error rates. The basic concept is elegantly simple. Search your spectra against both real protein sequences and fake sequences. Since all matches to fake sequences are definitely wrong, counting these decoy matches tells you approximately how many false matches you have among your real results.
Implementation requires creating a decoy database. The most common approach reverses each protein sequence in your target database. If a real protein has the sequence MVSKGEELFTGVVPILVELDGDVNGHKFSVSGEGEGDATYGKL, the decoy becomes LKGYTADGEGEGSVSFKHGNVDGDLEVLIPVVGTFLEEGSKSVM. Reversing preserves amino acid composition and length while creating sequences that definitely do not exist in nature.
The critical assumption underlying target-decoy is that false matches distribute equally between target and decoy databases. If this assumption holds, the number of decoy matches at any score threshold estimates the number of false target matches at that threshold. Doubling the decoy count approximates total false discoveries.
FDR calculation becomes straightforward: divide decoy hits by target hits at your chosen score threshold. If you have 100 target matches and 5 decoy matches above a certain score, your estimated FDR is 5%. This simple formula powers most peptide quantification software packages.
Concatenated versus separate searches
Two strategies exist for implementing target-decoy searches, and the choice affects your FDR calculations. Understanding both helps interpret results from different software packages.
Concatenated search combines target and decoy databases into a single search. Each spectrum competes against all sequences simultaneously. If a decoy peptide scores higher than all target peptides for a given spectrum, the decoy wins and gets reported. This competition means some spectra that might have matched targets will instead match decoys.
The competition in concatenated searches slightly reduces sensitivity. Some correct matches get beaten by slightly higher-scoring decoy matches. However, this approach provides more accurate FDR estimates because it directly models the competition between true and false matches that occurs in the target database.
Separate search runs target and decoy searches independently. Each spectrum gets a best match from targets and a best match from decoys. Researchers then compare these parallel results to estimate FDR. This approach preserves all potential target matches but may overestimate FDR slightly.
Most modern software uses concatenated searches with appropriate corrections. MaxQuant, Proteome Discoverer, and similar platforms implement variations of this approach. The specific implementation matters for absolute FDR values but does not change the fundamental relationship between peptide and protein FDR levels.
Decoy generation methods
Creating appropriate decoy sequences requires careful consideration. Poor decoy generation violates the fundamental assumption that false matches distribute equally between targets and decoys.
Sequence reversal remains the most common and reliable method. Reversing each protein sequence creates decoys with identical amino acid composition and length as corresponding targets. This preserves important properties that affect search scores, ensuring decoys compete fairly with targets.
One refinement keeps the C-terminal amino acid fixed during reversal. Since trypsin cleaves after lysine and arginine, keeping these residues at peptide C-termini maintains realistic peptide properties. This small change improves decoy quality without adding complexity.
Sequence shuffling randomly rearranges amino acids within each protein. This creates more diverse decoys but may generate some sequences that accidentally match real proteins, especially for short peptides. Shuffling with constraints can mitigate this issue.
Pseudo-random sequences generate entirely new sequences matching the amino acid frequency distribution of your target database. This approach works well but requires more computational effort and careful implementation to avoid systematic biases.
For most applications, simple sequence reversal provides reliable results. Only specialized applications require more sophisticated decoy generation strategies.
Why peptide FDR and protein FDR differ
Now we reach the central question. Why does a high peptide FDR often produce a low protein FDR? The answer lies in how evidence accumulates differently for true and false protein identifications.
True proteins in your sample produce real peptide signals.
These peptides get identified because the mass spectrometer actually detected them, fragmented them, and recorded their characteristic patterns. True proteins tend to have multiple peptides identified because abundant proteins generate many detectable peptides. The evidence supporting true proteins comes from multiple independent observations.
False protein identifications arise from random high-scoring peptide matches. But here is the key insight: random matches do not cluster onto the same false proteins. If peptide A randomly matches a spectrum, and peptide B randomly matches a different spectrum, peptides A and B have no reason to map to the same protein. False evidence is scattered randomly across the database.
This asymmetry has profound implications. True proteins accumulate evidence from multiple peptides. False proteins typically have only one or two supporting peptides, usually just one. When you require two or more unique peptides to call a protein identification, you eliminate most false positives while retaining most true positives.
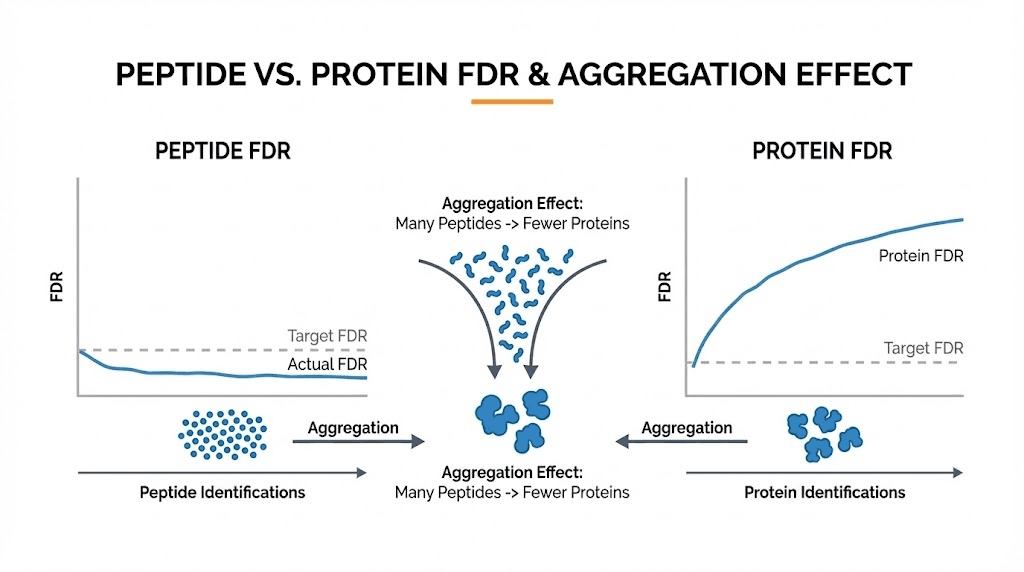
The aggregation effect
Consider a concrete example. Your experiment identifies 10,000 peptides with 5% FDR. That means approximately 500 peptide identifications are wrong. These 500 false peptides distribute across perhaps 450 different proteins in your database. Most false proteins have exactly one false peptide supporting them.
Now apply the two-peptide rule. You require each protein to have at least two unique peptides for confident identification. Among your true proteins, most easily meet this criterion because real proteins generate multiple detectable peptides. Perhaps 2,000 true proteins have two or more peptides each.
Among false proteins, almost none meet the two-peptide criterion. Each false peptide maps to a different random protein. The probability that two independent false peptide matches land on the same protein is extremely low. Maybe 5-10 false proteins survive the two-peptide filter.
Your final protein list contains 2,000 true proteins and 5-10 false proteins. The protein FDR drops to 0.25-0.5%, despite starting with 5% peptide FDR. The aggregation effect naturally purifies your results at the protein level.
This explains the paradox. High peptide FDR does not mean high protein FDR because false peptides do not cluster the way true peptides do.
Mathematical formalization
We can express this relationship more precisely. Let P be the peptide FDR and N be the number of identified peptides. The expected number of false peptides is approximately P times N.
If peptides distribute randomly across D database proteins, the probability that a specific protein receives two false peptide matches is roughly (P times N divided by D) squared. For typical numbers where P equals 0.05, N equals 10000, and D equals 20000, this probability is approximately 0.0006 per protein.
Expected false proteins with two or more peptides equals D times the probability, giving about 12 false proteins. If 2000 true proteins pass the two-peptide filter, protein FDR is 12 divided by 2000, or 0.6%.
This simplified calculation ignores many real-world complications but captures the essential mechanism. The quadratic dependence on peptide FDR explains why protein FDR drops so dramatically when requiring multiple peptide evidence.
Software implementations use more sophisticated calculations accounting for unequal peptide distribution, shared peptides, and protein-specific properties. But the fundamental insight remains: requiring multiple independent pieces of evidence dramatically reduces false discovery rates because false matches do not aggregate the way true matches do.
Protein inference complexities
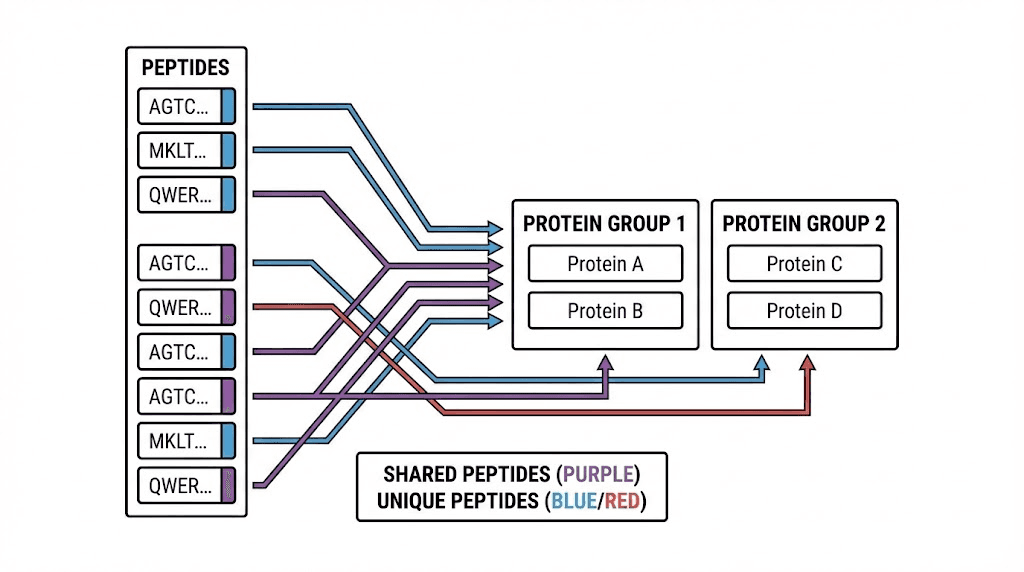
The relationship between peptide and protein FDR depends critically on how you infer proteins from peptide evidence. Protein inference is not straightforward because peptide-to-protein mapping is many-to-many rather than one-to-one.
A single peptide sequence might exist in multiple proteins due to shared domains, gene families, or protein isoforms. Conversely, each protein contains many peptides, only some of which get detected in any given experiment. This complexity creates the protein inference problem, which has been studied extensively in proteomics.
Different inference strategies produce different protein lists from identical peptide inputs. Your choice of inference method affects not only which proteins you report but also how FDR calculations apply to your results. Understanding these nuances helps you interpret your data correctly and communicate your methods accurately.
Shared peptides create ambiguity
When a peptide sequence appears in multiple database proteins, you cannot determine which protein produced that peptide. These shared peptides, sometimes called degenerate peptides, create fundamental ambiguity in protein identification.
Consider a peptide matching both protein A and protein B. If this is the only peptide identified from either protein, you cannot say which was present. Maybe both were present. Maybe only one. The data simply does not resolve this question.
Software handles shared peptides differently. Some tools report all matching proteins, inflating protein counts. Others apply parsimony principles, reporting the minimum set of proteins that explains all observed peptides. Still others use probabilistic models that distribute evidence across potential source proteins.
The handling of shared peptides affects FDR calculations significantly. If you report all potential proteins for each shared peptide, you inflate both true and false protein counts. If you apply strict parsimony, you may miss real proteins while also reducing false positives. Different approaches have different FDR characteristics.
Protein groups and parsimony
The parsimony principle addresses shared peptide ambiguity by reporting the smallest protein set that explains all observations. If proteins A and B share all their identified peptides, reporting both would be redundant. Parsimony reports them as a single protein group.
Protein groups complicate FDR interpretation. A protein group containing five members represents different certainty than a protein identified by unique peptides. Some tools calculate group-level FDR, while others calculate protein-level FDR. These are different quantities measuring different things.
The two-peptide rule interacts with protein grouping in complex ways. A protein group might have ten supporting peptides, all shared among group members. None of these provides unique evidence for any specific protein. Whether this group passes the two-peptide filter depends on how you count shared peptides.
Modern software handles these complexities with sophisticated algorithms. MaxQuant uses protein groups with careful evidence partitioning. Proteome Discoverer offers multiple grouping strategies. Understanding your software's approach helps you interpret its FDR estimates correctly.
Protein scoring approaches
How you score proteins for ranking affects FDR estimation. Different scoring methods emphasize different aspects of peptide evidence.
Best peptide score assigns each protein the score of its highest-scoring peptide. Simple to implement, but ignores evidence from additional peptides. This approach tends to overestimate protein FDR because it does not reward multiple peptide support.
Summed scores add up evidence across all peptides. Proteins with more peptides score higher. This naturally implements something like the two-peptide effect, though without explicit thresholding. However, larger proteins with more potential peptides have advantages unrelated to actual abundance.
Multiplicative models combine peptide probabilities. If peptide A has 1% error probability and peptide B has 1% error probability, the combined error probability is 0.01%. This explicitly models the aggregation effect and naturally produces low protein FDR from moderate peptide FDR.
Machine learning approaches learn optimal combinations from training data. Tools like Percolator use support vector machines to combine multiple features into optimized scores. These methods often achieve the best sensitivity at fixed FDR but require careful validation to ensure FDR estimates remain accurate.
The picked protein approach, developed for large-scale studies, addresses target-decoy imbalances that emerge in big datasets. For each protein, it compares the target score against the corresponding reversed decoy score. This competition-based approach provides more accurate FDR estimates than traditional methods when analyzing thousands of samples.
Practical implications for your research
Understanding the peptide-protein FDR relationship has practical consequences for how you design experiments, set filtering thresholds, and report results.
Getting these decisions right affects both the quality of your conclusions and how others can build upon your work.
The central lesson is that FDR thresholds at different levels have different meanings. A 1% peptide FDR produces much lower protein FDR under typical conditions. Conversely, if you want 1% protein FDR and work backward, you could accept higher peptide FDR while still maintaining rigorous protein-level control.
This insight helps optimize sensitivity. Many researchers apply 1% FDR at every level, cumulative filtering that may be unnecessarily conservative. Understanding the aggregation effect allows more nuanced threshold selection that maximizes true discoveries while maintaining acceptable error rates.
Choosing appropriate FDR thresholds
What FDR threshold should you use? The answer depends on your research goals and the downstream consequences of false discoveries.
For discovery proteomics where you will validate interesting hits through other methods, relatively relaxed thresholds may be appropriate. A 5% protein FDR means one in twenty reported proteins might be wrong. If you follow up with Western blots or targeted mass spectrometry, these false positives will reveal themselves. The cost of a false positive is one failed validation experiment.
For clinical applications or databases meant to serve as references, stricter thresholds become necessary. A false positive protein in a diagnostic test could lead to incorrect medical decisions. A false positive in a reference database propagates misinformation to other researchers. Here, 1% or even 0.1% FDR may be warranted despite the loss of sensitivity.
For quantitative comparisons, FDR interacts with statistical testing in subtle ways. A protein that exists in your FDR-filtered list but was actually a false positive will show random abundance patterns. This adds noise to your quantitative analysis. Very large studies with thousands of protein comparisons benefit from strict FDR control to minimize this noise source.
Software settings and their effects
Different software packages expose different FDR-related settings. Understanding these options helps you configure analyses appropriately for your research needs.
MaxQuant applies FDR separately at PSM, peptide, and protein levels. Default settings use 1% at each level. The protein FDR specifically uses the MaxLFQ algorithm for protein quantification combined with target-decoy validation. Protein groups get special handling to avoid the issues with shared peptides.
Proteome Discoverer offers configurable FDR through various processing nodes. The Percolator node provides machine learning-based rescoring that often improves sensitivity at fixed FDR. Users can specify target FDR separately for PSMs, peptides, and proteins, with various consensus algorithms available for protein inference.
Spectronaut and other DIA software face different FDR challenges because data-independent acquisition generates different error modes than traditional data-dependent acquisition. These tools use library matching rather than database searching, with corresponding adaptations to FDR estimation.
Whatever software you use, document your FDR settings carefully in publications. Stating that you used 1% FDR without specifying the level leaves ambiguity. State explicitly: 1% PSM FDR, 1% peptide FDR, and 1% protein FDR, or however you actually configured your analysis.
The two-peptide rule revisited
Requiring two or more unique peptides per protein has become common practice, sometimes mandated by journals. This rule exploits the aggregation effect to reduce false positive proteins. But is it always appropriate?
Arguments for the two-peptide rule are strong. As we have seen, requiring two peptides dramatically reduces protein FDR. The mathematics are clear: false matches rarely cluster onto the same protein. Following this rule provides conservative, defensible results that withstand scrutiny.
Arguments against highlight the cost in sensitivity. Many real proteins produce only one detectable peptide, especially low-abundance proteins, small proteins, and proteins with unfavorable sequences for tryptic digestion. The two-peptide rule systematically excludes these proteins regardless of how confident that single peptide match might be.
Modern approaches suggest flexibility. Instead of a hard rule, consider the protein FDR directly. If your analysis achieves 1% protein FDR including single-peptide proteins, there is no statistical reason to exclude them. The combined evidence of a very confident single peptide match plus proper FDR control may provide sufficient support.
For publication, follow journal requirements. But for internal decision-making and comprehensive dataset analysis, consider the actual FDR achieved rather than arbitrary peptide count thresholds.
Common misconceptions clarified
Several misconceptions about peptide and protein FDR persist in the literature and informal discussions. Clarifying these helps you interpret your own results and evaluate others' work more critically.
Misconception: peptide FDR accumulates to protein FDR
Some researchers believe that if 5% of peptides are wrong, then proteins built from those peptides must have even higher error rates. The errors accumulate, they reason, like defects in an assembly line.
This intuition is backwards. The aggregation effect means protein FDR is typically lower than peptide FDR, not higher. True proteins benefit from multiple supporting peptides while false proteins do not. The assembly line analogy fails because false peptides do not assemble into false proteins the way components assemble into products.
If anything, information improves as you move up levels. A single PSM provides limited confidence. The same peptide supported by multiple PSMs provides more confidence. A protein supported by multiple confident peptides provides even more confidence. Each level adds context that helps distinguish true from false identifications.
Misconception: strict peptide FDR guarantees strict protein FDR
Another misconception runs in the opposite direction. Some assume that very strict peptide FDR, say 0.1%, automatically ensures very strict protein FDR. While directionally correct, this oversimplifies.
The relationship between levels depends on dataset characteristics. In experiments that identify few peptides per protein, the aggregation effect is weaker. If most proteins have only one or two peptides, false proteins can survive with single false peptide matches. The gap between peptide and protein FDR narrows.
Large-scale experiments that identify many peptides per protein show stronger aggregation effects. The gap between peptide and protein FDR widens. But this also depends on database size, protein size distribution, and shared peptide frequencies.
Rather than assuming relationships, measure protein FDR directly using appropriate methods. Target-decoy approaches can estimate FDR at any level if properly implemented.
Misconception: decoy proteins behave like false target proteins
Target-decoy estimation assumes decoy matches model false target matches. This assumption works well for peptides, where false matches arise from random score fluctuations that affect targets and decoys equally.
At the protein level, complications emerge. Large proteins accumulate more random high-scoring peptide matches than small proteins simply because they contain more potential peptide sequences. Both target and decoy large proteins benefit from this size effect, but not equally in all implementations.
The picked protein approach addresses this by comparing each target protein against its specific decoy counterpart. This protein-level competition provides more accurate FDR estimates than simply counting decoy proteins. Modern software increasingly implements such improved estimation methods.
Understanding these nuances helps you evaluate whether your FDR estimates are trustworthy for your specific dataset and analysis approach.
Advanced FDR concepts
Beyond basic FDR estimation, several advanced concepts matter for sophisticated proteomics analysis. These become relevant for large-scale studies, clinical applications, and methods development.
Local versus global FDR
Global FDR measures error rate across your entire filtered dataset. If you report 1000 proteins at 1% FDR, approximately 10 are expected to be wrong. You do not know which 10, just that the overall proportion is about 1%.
Local FDR, sometimes called posterior error probability, estimates error probability for individual identifications. A peptide with 0.1% local FDR has a 0.1% chance of being wrong, while another peptide with 5% local FDR has a 5% chance of being wrong. Both might pass a 5% global FDR threshold but have different individual confidences.
Local FDR provides richer information for downstream analysis. When prioritizing proteins for validation, prefer those with lower local FDR. When weighting quantitative data, account for identification uncertainty through local FDR. When combining evidence across experiments, local FDR enables principled integration.
Calculating local FDR requires modeling score distributions for correct and incorrect matches, then applying Bayes theorem. Tools like Percolator estimate local FDR alongside global FDR. The computational overhead is modest compared to the additional information gained.
FDR in multi-experiment studies
Large proteomics projects analyze hundreds or thousands of samples. FDR behavior changes at this scale in ways that can surprise researchers accustomed to single-experiment analysis.
If you apply 1% protein FDR to each of 1000 experiments independently, each experiment has about 1% false proteins. But across all experiments combined, false proteins accumulate. A protein that appears false positive in one experiment will appear in that experiment's results. Different experiments will have different false positives.
Two approaches address multi-experiment FDR. The first controls FDR at the experiment level, accepting that combined results have inflated error rates. This approach prioritizes sensitivity within each experiment. The second controls FDR across the entire study, typically by combining all data before filtering. This approach provides study-wide error control but may be overly conservative for individual experiments.
For longitudinal studies or clinical trials, consistency matters. You want the same proteins identified across samples analyzed at different times. Batch effects in FDR thresholds can create artificial differences between samples. Careful experimental design and analysis help minimize these effects.
Entrapment methods for FDR validation
Target-decoy FDR estimates are estimates, not ground truth. How do you know if your FDR calculations are accurate? Entrapment methods provide one validation approach.
Entrapment adds known-absent proteins to your search database. These might be proteins from a different organism that definitely do not exist in your sample. Any identifications of entrapment proteins are definitely false positives. Comparing the number of entrapment hits against your FDR estimate tests whether the estimate is accurate.
If your analysis reports 1% protein FDR and includes 100 entrapment proteins, you expect about 1 entrapment protein in your results. If you actually find 5 entrapment proteins, your FDR is underestimated. If you find 0 entrapment proteins in multiple experiments, your FDR may be overestimated or you might need more entrapment sequences for reliable testing.
Entrapment validation has become standard for methods development papers. It provides empirical evidence that FDR calculations perform as claimed. For routine analysis, periodic entrapment validation helps verify that your analysis pipeline remains calibrated over time.
Software implementation details
Different software packages implement peptide and protein FDR estimation differently. Understanding these implementation details helps you configure tools appropriately and interpret their outputs correctly. The software choices you make directly affect what FDR numbers mean for your specific analysis.
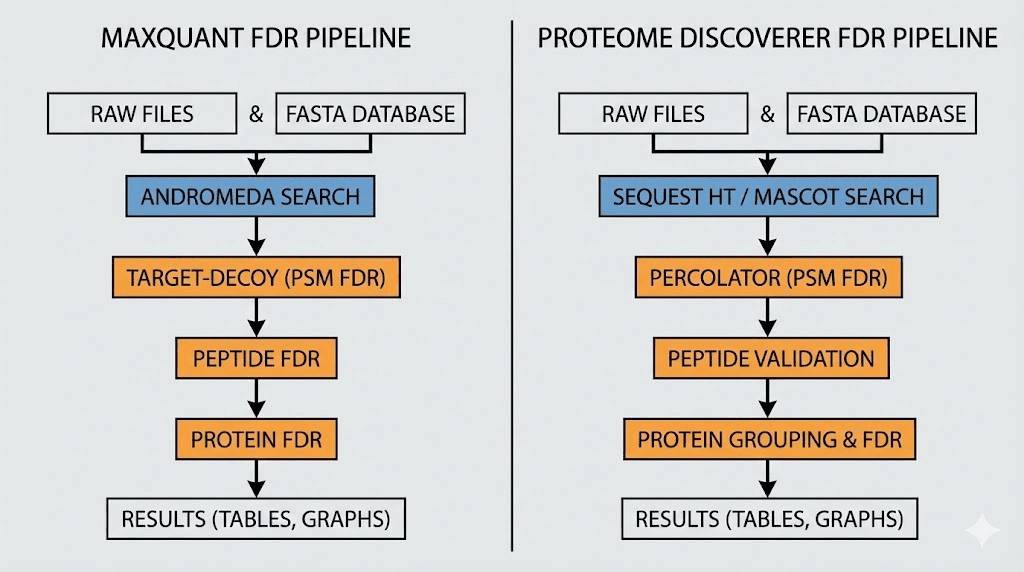
MaxQuant approach
MaxQuant implements FDR estimation at multiple levels using the Andromeda search engine. The software creates reversed sequence decoys automatically and performs concatenated searches.
FDR thresholds can be set independently for PSMs, peptides, and proteins.
At the protein level, MaxQuant uses protein groups to handle shared peptides. The software calculates protein scores based on the product of constituent peptide posterior error probabilities. This multiplicative model explicitly captures the aggregation effect: multiple peptides provide exponentially more confidence than single peptides.
The razor peptide concept in MaxQuant assigns shared peptides to the protein with the most total evidence. This pragmatic approach avoids counting the same evidence multiple times while acknowledging the inherent ambiguity. Razor peptide assignments can affect quantification, so understanding this concept matters for accurate abundance measurements.
MaxQuant also implements the picked protein approach for large-scale studies. When analyzing many samples, this method provides more accurate protein FDR estimates by competing each target protein against its specific decoy rather than comparing aggregate counts.
Proteome Discoverer workflow
Proteome Discoverer offers flexible workflow construction with various nodes for FDR estimation. The SEQUEST HT or Mascot search nodes produce initial identifications. The Percolator node can rescore these identifications using machine learning, often improving sensitivity at fixed FDR.
Protein FDR in Proteome Discoverer depends on the consensus workflow configuration. The software offers multiple protein inference algorithms with different approaches to shared peptides and protein scoring. Understanding your selected algorithm helps interpret the resulting protein FDR estimates.
The Master Protein Picker node implements parsimony-based inference. It identifies the minimum protein set explaining observed peptides and assigns confidence levels based on unique peptide support. Proteins with only shared peptide evidence receive lower confidence than those with unique peptides.
Recent versions of Proteome Discoverer include machine learning components for improved FDR estimation. These learn from your data to optimize score combinations, potentially achieving better sensitivity while maintaining accurate FDR control.
Specialized tools
Beyond major platforms, specialized tools address specific FDR challenges.
PeptideShaker combines results from multiple search engines. Different engines have different strengths and produce partially non-overlapping identifications. Combined results can achieve better coverage than any single engine. PeptideShaker implements careful FDR estimation for these combined searches, accounting for the correlations between search engine results.
Percolator applies support vector machines to learn optimal score functions from target-decoy data. Originally developed as a standalone tool, Percolator is now integrated into several platforms. Its semi-supervised learning approach typically improves sensitivity by 10-30% compared to raw search engine scores.
MAYU specifically addresses protein FDR estimation for large-scale experiments. It implements the picked protein approach and provides diagnostic plots for evaluating FDR estimate quality.
Researchers working with very large datasets find MAYU valuable for accurate error rate assessment.
SeekPeptides resources can help researchers understand the broader context of peptide science beyond proteomics analysis, connecting analytical chemistry concepts to practical applications in research and biotechnology.
Case studies illustrating the peptide-protein FDR relationship
Concrete examples help solidify understanding of how peptide and protein FDR interact in real experiments. These case studies illustrate typical scenarios and highlight important considerations for interpreting your own results.
Case study 1: standard cell line proteomics
A researcher analyzes HeLa cell lysate using standard bottom-up proteomics with 2-hour LC gradient and high-resolution MS/MS. The database search against human SwissProt (20,000 proteins) identifies 45,000 PSMs, 35,000 peptides, and 4,500 proteins at 1% FDR at each level.
With 1% peptide FDR, approximately 350 peptides are expected to be false. These false peptides distribute across approximately 340 different proteins in the database. After the two-peptide filter embedded in the protein inference, only 3-5 false proteins remain in the final list.
The protein FDR at this stage, before explicit filtering, is about 0.1%, not 1%. Applying an additional 1% protein FDR filter barely changes the results because the inherent aggregation effect already reduced false positives below 1%. This experiment illustrates how the two-peptide requirement implicit in most protein scoring approaches already captures most of the FDR reduction benefit.
Case study 2: low-input single-cell proteomics
A single-cell proteomics experiment analyzes individual cells with limited material. Each cell yields only 2,000 PSMs identifying 1,500 peptides and 600 proteins at 1% FDR thresholds. With fewer peptides per protein compared to bulk analysis, the aggregation effect is weaker.
At 1% peptide FDR, approximately 15 peptides are expected to be false. With shallower coverage, proteins average fewer peptides each. The probability that two false peptides randomly hit the same protein increases when mapping is sparse. Protein FDR might be 0.5-0.8%, closer to the peptide FDR than in the bulk experiment.
Single-cell researchers often relax the two-peptide requirement, accepting single-peptide proteins to maximize coverage. This trades increased false positive risk for better sensitivity. Whether this tradeoff is appropriate depends on experimental goals and how results will be used.
Case study 3: large-scale clinical cohort
A clinical study analyzes 1,000 plasma samples looking for disease biomarkers. Each sample identifies 500-800 proteins with standard plasma proteomics protocols. Across the entire study, approximately 2,500 unique proteins appear in at least one sample.
With 1% protein FDR per sample, each sample has about 5-8 expected false positive proteins. Across 1,000 samples, hundreds of distinct false positive proteins will appear somewhere in the dataset. The accumulated false positives represent noise that complicates biomarker discovery.
Stricter FDR thresholds help. At 0.1% protein FDR per sample, each sample has less than 1 expected false positive protein. Study-wide, perhaps 50-100 false positive proteins appear across all samples. This dramatically reduces noise for comparing protein abundance between disease and control groups.
The clinical researchers must balance stringent FDR against sensitivity loss. Rare biomarkers detected in only some samples need sufficient sensitivity to be captured. The optimal threshold depends on the specific disease biology and downstream validation capacity.
Best practices for FDR reporting
Clear FDR reporting improves reproducibility and helps other researchers evaluate and build upon your work. Vague or incomplete reporting creates confusion and may lead others to misinterpret your results.
What to report
At minimum, report FDR thresholds at each identification level. State explicitly: 1% PSM FDR, 1% peptide FDR, and 1% protein FDR. If you used different thresholds at different levels, explain the rationale.
Report the method used for FDR estimation. Target-decoy with reversed sequences is standard, but stating this confirms your approach. If you used Percolator rescoring or other enhancements, mention these. The specific software version matters because implementations evolve over time.
Report how you handled protein inference. Did you use parsimony? Protein groups? The two-peptide rule? How did you handle shared peptides? These decisions affect final protein lists and FDR calculations.
For large-scale studies, specify whether FDR was controlled per-experiment or study-wide. Different approaches have different implications for interpreting combined results.
Common reporting problems
Ambiguous level specification occurs when papers state 1% FDR without clarifying PSM, peptide, or protein level. Given the substantial differences between levels, this ambiguity prevents proper interpretation.
Always specify the level.
Missing method details prevent reproduction. If you used custom FDR calculation, describe the algorithm. If you used standard software with modified settings, document the modifications. Details that seem obvious may not be obvious to readers or future you trying to reproduce results.
Inappropriate threshold comparisons happen when comparing results across studies using different FDR thresholds or levels. A study reporting 5% peptide FDR is not directly comparable to one reporting 1% protein FDR. Normalize comparisons by using consistent criteria or explicitly acknowledging the differences.
Supplementary data recommendations
Beyond minimal reporting, comprehensive supplementary data supports thorough evaluation of your results.
Include full identification lists with individual confidence measures. Providing peptide posterior error probabilities or local FDR values enables readers to refilter at different thresholds for their own analyses. This openness supports reuse of your data.
Include decoy match counts alongside target counts. This allows readers to verify FDR calculations independently. Discrepancies between stated FDR and raw counts indicate potential problems worth investigating.
Include diagnostic plots showing score distributions for targets and decoys. These plots reveal whether basic target-decoy assumptions hold for your data. Overlapping distributions or unexpected patterns warrant discussion or additional validation.
Consider depositing raw data in public repositories like PRIDE or MassIVE. Raw data enables complete reanalysis with different software or parameters. As methods improve, archived data gains value through reanalysis with better tools.
Future directions in FDR estimation
FDR estimation methods continue evolving as proteomics technology and datasets grow. Several trends point toward improved methods in coming years.
Machine learning approaches
Deep learning is beginning to influence FDR estimation. Neural networks can learn complex relationships between spectrum features and identification confidence without explicit modeling assumptions. Early applications show promise for improved sensitivity while maintaining accurate FDR control.
Semi-supervised approaches like Percolator use target-decoy labels to train classifiers that rescore identifications.
Fully supervised approaches would require ground-truth labels that are difficult to obtain for real proteomics data. Hybrid approaches combining simulation, entrapment, and target-decoy strategies may bridge this gap.
Transfer learning could enable models trained on large public datasets to improve FDR estimation for smaller experiments. The proteomics community's growing data resources provide unprecedented training opportunities for such approaches.
Improved protein-level methods
Protein FDR estimation remains less mature than peptide FDR estimation. The complexities of protein inference, shared peptides, and protein groups create challenges that current methods handle imperfectly.
Recent work on picked protein groups extends the picked protein approach to handle shared peptides more rigorously. This addresses the situation where protein groups share peptides with each other, creating nested ambiguities that simpler methods handle inconsistently.
Bayesian approaches model uncertainty throughout the inference pipeline, propagating probability estimates from spectra through peptides to proteins. While computationally intensive, these methods provide principled uncertainty quantification that simple FDR thresholds cannot capture.
Context-dependent FDR
Current FDR methods treat all identifications equivalently. A peptide from an expected protein is scored the same as a peptide from a surprising protein. But prior biological knowledge could inform FDR calculations.
If analyzing a muscle sample, peptides from muscle-specific proteins have higher prior probability of being correct than peptides from neuron-specific proteins. Incorporating such priors could improve both sensitivity and specificity, correctly identifying more true muscle peptides while being more skeptical of unexpected hits.
Implementation challenges include defining appropriate priors without biasing discovery.
The goal is leveraging biological knowledge to improve statistical power, not circular reasoning where you only find what you expected. Careful methodological development addresses these concerns.
Connecting proteomics FDR to practical applications
While this guide has focused on the technical aspects of FDR in proteomics, these concepts connect to broader applications in peptide science and biotechnology. Researchers studying peptide therapeutics, developing biomarkers, or characterizing biological systems all benefit from understanding how identification confidence is established and controlled.
Mass spectrometry-based proteomics provides the foundation for much of our knowledge about which peptides exist in biological systems, how they behave, and what functions they serve. The statistical rigor of FDR estimation ensures this knowledge rests on solid foundations. Without proper error control, false discoveries would contaminate databases, mislead research directions, and potentially affect clinical decisions.
SeekPeptides serves researchers across the spectrum of peptide science, from those working directly with mass spectrometry to those using peptides in therapeutic or research applications. Understanding the analytical chemistry foundations, including FDR concepts, helps all researchers evaluate the quality of peptide identification data they encounter.
The principles discussed here, requiring multiple independent pieces of evidence, using appropriate controls, understanding how errors propagate and aggregate, apply broadly beyond proteomics.
These are fundamental concepts in experimental science that happen to have particularly well-developed implementations in the proteomics field.
Frequently asked questions
What is the difference between FDR and false positive rate?
False positive rate measures the proportion of true negatives that are incorrectly called positive. FDR measures the proportion of positive calls that are incorrect.
In proteomics, FDR is more useful because you typically do not care about the vast majority of database proteins that are not in your sample. You care about the quality of the proteins you actually report. FDR directly addresses this question by estimating what fraction of your reported proteins are wrong.
Can I compare protein lists generated with different FDR thresholds?
With caution. Different FDR thresholds produce different numbers of identifications. A 5% FDR list contains more proteins than a 1% FDR list from the same data. If comparing across studies, consider reprocessing with matched thresholds or acknowledge the limitation. Proteins appearing at strict thresholds in one study but missing at relaxed thresholds in another warrant investigation rather than simple presence/absence comparison.
Why do some software packages report very different protein numbers from the same data?
Protein inference algorithms differ substantially. Parsimony-based methods report minimum protein sets. Probabilistic methods may report larger sets with associated confidence scores. How shared peptides are handled, whether protein groups are reported or expanded, and exact score calculation methods all affect final protein counts. The same underlying data can legitimately produce different protein lists depending on inference choices, each with its own valid interpretation.
Should I always use the two-peptide rule for protein identification?
Not necessarily. The two-peptide rule provides conservative results but sacrifices sensitivity for low-abundance and small proteins. If your protein FDR is already well-controlled through other means, including single-peptide proteins may be appropriate. Consider your experimental goals. Biomarker discovery may warrant inclusion of confident single-peptide identifications. Reference database construction may warrant exclusion for maximum reliability. The appropriate choice depends on context.
How does peptide length affect FDR calculations?
Longer peptides have more potential fragmentation sites and typically produce more informative spectra. This can lead to higher confidence matches. However, longer peptides are also less common in standard tryptic digests, so they are searched less frequently. The net effect on FDR depends on your specific database and experimental conditions. Some peptide types, like semi-tryptic peptides or those with modifications, have different FDR characteristics that some software handles separately.
What happens to FDR when I filter on additional criteria like peptide length or charge?
Post-hoc filtering affects FDR in ways that target-decoy estimates may not capture. If you filter peptides by charge state after FDR calculation, the remaining peptides may have different true FDR than estimated. Re-running target-decoy analysis on the filtered set provides more accurate estimates. Software that integrates such filters into the scoring and FDR calculation handles this automatically.
How do I choose between 1% and 5% FDR for my experiment?
Consider the consequences of false positives and false negatives for your specific application. Discovery experiments where you will validate hits can tolerate higher FDR for better sensitivity. Reference databases and clinical applications warrant lower FDR for reliability. Quantitative studies benefit from lower FDR to reduce noise.
Most researchers use 1% at both peptide and protein levels as a reasonable default, but this is convention rather than universal optimum.
Can FDR estimation fail completely?
Yes, in certain edge cases. Very small databases may not provide enough decoy sequences for reliable estimation. Modified amino acids or non-standard sequences that are underrepresented in decoy databases can have higher actual error rates than estimated. Highly fractionated samples with extreme depth may show FDR drift over acquisition time. Always examine diagnostic plots and consider validation through orthogonal methods for critical applications.
For researchers exploring the broader world of peptide science and applications, SeekPeptides provides comprehensive resources covering peptide mechanisms, dosing protocols, storage guidelines, and safety information that complement the analytical chemistry foundations discussed in this guide.