Jan 23, 2026

The numbers stare back at you. Retention time 12.4 minutes. Molecular weight 1209.4 Da. Purity 98.7%. You paid good money for this peptide, and now you are holding a piece of paper filled with data you cannot interpret.
This happens constantly. Researchers spend hundreds or thousands of dollars on peptides, receive their vials with a certificate of analysis, and have no idea whether those numbers indicate quality product or expensive waste. The peptide testing labs producing these reports assume a level of technical knowledge that most buyers simply do not possess.
The consequences of this knowledge gap are significant. Bad peptides produce bad results. Worse, they can produce results that appear legitimate but lead research in completely wrong directions. A peptide contaminated with deletion sequences might show activity, but that activity could come from something other than the intended compound. You might spend months optimizing a protocol for a peptide that was never what the label claimed.
SeekPeptides members regularly ask about interpreting their peptide documentation. These questions reveal a consistent pattern. Most researchers can read the purity number but miss the details that actually matter. They see 99% purity and assume everything is perfect, not realizing that the mass spectrometry results show a molecular weight discrepancy suggesting their peptide is missing an amino acid.
Understanding peptide and protein report sheets is not optional for serious research. It is foundational. Without this knowledge, you are trusting vendors blindly, assuming quality rather than verifying it, and potentially compromising every experiment that depends on your compounds. This guide breaks down every component of peptide analysis reports, explains what the numbers mean, shows you how to spot problems, and teaches you to distinguish excellent peptides from expensive junk.
What is a peptide report sheet and why does it matter
A peptide report sheet, most commonly called a Certificate of Analysis or COA, is the formal documentation that accompanies a peptide product. This document contains the results of analytical testing performed on your specific batch of peptide. It serves as verification that the peptide matches what was ordered, meets purity specifications, and is suitable for its intended research applications.
The importance of these reports cannot be overstated for anyone working with peptide research. Unlike purchasing a simple chemical reagent where the compound is either right or wrong, peptides exist on a spectrum of quality.
A peptide can be partially correct, mostly pure, or contaminated with closely related sequences that standard testing might not distinguish. The report sheet is your window into this complexity.
The anatomy of a standard COA
Every legitimate COA should contain several essential elements. At the top, you will find identifying information including the peptide name or sequence, lot number, and synthesis date. The lot number is critical because it links your specific vial to the testing results. If a vendor provides a generic COA without a lot number matching your product, that document is worthless.
The body of the COA contains the actual analytical results. Most COAs include at least two types of analysis. High performance liquid chromatography, abbreviated HPLC, provides the purity measurement. Mass spectrometry, either MALDI-TOF or ESI-MS, confirms molecular identity. Better COAs also include amino acid analysis, peptide content measurements, and additional purity assessments.
At the bottom, you should see the testing date, the name of the analyst or laboratory, and ideally some form of verification signature. Some high quality vendors include the actual chromatograms and mass spectra as attachments rather than just reporting the numbers. This additional documentation allows you to verify the results yourself rather than taking the reported values on faith.
Third party versus in house testing
Where the testing was performed matters enormously. In house testing means the peptide manufacturer performed its own quality control. Third party testing means an independent laboratory with no financial stake in the results conducted the analysis.
Both approaches can produce valid results, but third party testing eliminates potential conflicts of interest. A manufacturer has obvious incentives to report favorable results. An independent laboratory gains nothing from falsifying data and risks its reputation and accreditation if caught producing unreliable results.
When evaluating a vendor, look for documentation indicating which type of testing was performed. Some vendors perform in house screening then send a subset of batches for third party verification. This hybrid approach offers reasonable confidence while keeping costs manageable.
The best peptide vendors are transparent about their testing protocols and can provide third party documentation upon request.
Understanding HPLC purity analysis
High performance liquid chromatography remains the gold standard for determining peptide purity. This technique separates your peptide from any impurities based on how they interact with a specialized column. Pure peptides produce a single sharp peak. Impure peptides show multiple peaks representing the main compound plus various contaminants.
The purity percentage reported on your COA comes from analyzing the relative areas under these peaks. If the main peak represents 98% of the total peak area and various impurity peaks account for the remaining 2%, the peptide is reported as 98% pure. This calculation seems straightforward, but the details matter tremendously.
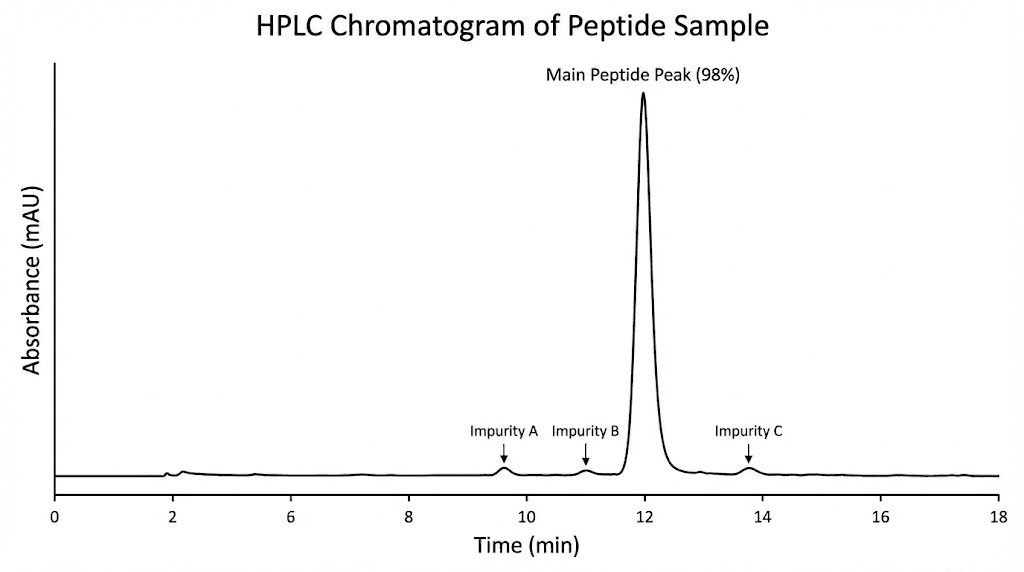
Reading an HPLC chromatogram
A chromatogram is a graph showing the detector response over time as compounds flow through the analytical column. The horizontal axis represents time in minutes from when the sample was injected. The vertical axis shows the detector signal, typically measured at 214 or 220 nanometers where the peptide bond absorbs ultraviolet light.
Your target peptide should appear as the dominant peak in the chromatogram. The retention time, when this peak appears, depends on the peptide sequence and the analytical conditions used. Hydrophobic peptides retain longer on the column and elute later. Hydrophilic peptides pass through more quickly.
Smaller peaks before and after your main peak represent impurities. Peaks eluting earlier than the main compound typically indicate more hydrophilic impurities, often truncated sequences missing hydrophobic amino acids. Later eluting peaks suggest more hydrophobic impurities, possibly oxidized forms or sequences containing additional amino acids.
What different purity levels mean
Purity grades follow general conventions across the industry. Understanding these tiers helps you match peptide quality to research requirements.
Peptides above 98% purity represent the highest commercial grade. These are suitable for quantitative binding studies, structural biology applications, and research requiring precise concentration calculations. At this level, impurities are minimal and unlikely to interfere with most experiments.
Peptides in the 95 to 97% range represent standard research grade quality. This level works well for screening experiments, cell culture studies, and applications where small amounts of impurity will not significantly affect results. Most beginning peptide researchers can work effectively at this purity level.
Peptides below 95% purity require caution. The increasing impurity load may affect experimental reproducibility. For some applications, this level remains acceptable, particularly for initial screening or when the target activity is robust. However, any unexpected results should prompt consideration of whether impurities might be responsible.
Peptides below 90% purity should generally be avoided for quantitative research. The impurity burden becomes substantial, and you cannot be confident that observed effects come from your intended compound rather than contaminants. These low purity preparations might be acceptable for very preliminary work but should not be used for any serious investigation.
HPLC method variations and their impact
Not all HPLC purity measurements are directly comparable. The separation method used significantly affects the reported purity. Two laboratories analyzing the same peptide sample might report different purity values depending on their specific protocols.
Gradient programs vary between laboratories. A slow gradient might separate impurities that a fast gradient would combine into the main peak. This means a peptide might appear 99% pure under one set of conditions and 96% pure under another, even though the actual sample is identical.
Column chemistry also affects separation. Most peptide HPLC uses C18 reversed phase columns, but column manufacturers, particle sizes, and column dimensions differ. These variations influence which impurities are resolved and which remain hidden.
Detection wavelength matters as well. Peptides are typically detected at 214 nm where the amide bond absorbs. Some methods use 220 or 280 nm instead. At 280 nm, only peptides containing aromatic amino acids like tryptophan, tyrosine, or phenylalanine produce strong signals. A peptide lacking these residues might show artificially high purity at 280 nm simply because certain impurities are invisible at that wavelength.
When comparing COAs from different sources, note the analytical method used. Reputable laboratories include method details on their COAs. If method information is missing, the purity values become harder to interpret in absolute terms.
Mass spectrometry for identity confirmation
HPLC tells you how pure your sample is.
Mass spectrometry tells you what your sample actually is. These complementary techniques together provide confidence that your peptide is both pure and correct.
Mass spectrometry works by ionizing molecules and measuring their mass to charge ratio. For peptides, this provides the molecular weight of your compound. Since each amino acid has a specific mass, the total molecular weight should match the calculated value for your target sequence. Any deviation indicates a problem.
Types of mass spectrometry used for peptides
Two ionization methods dominate peptide analysis. Matrix assisted laser desorption ionization with time of flight detection, abbreviated MALDI-TOF, is commonly used for rapid identity confirmation. Electrospray ionization mass spectrometry, or ESI-MS, provides complementary information and is standard in more comprehensive analyses.
MALDI-TOF excels at providing quick molecular weight measurements. The technique involves mixing your peptide with a matrix compound that absorbs laser energy. When the laser fires, the matrix vaporizes and carries your peptide into the gas phase as ions. These ions travel down a flight tube, with lighter ions arriving at the detector before heavier ones. The arrival time correlates precisely with molecular weight.
ESI-MS uses a different approach. Your peptide solution flows through a charged needle, forming a fine spray of charged droplets. As solvent evaporates, multiply charged peptide ions emerge. Because peptides can carry multiple charges in ESI, you see multiple peaks representing the same molecule with different numbers of protons attached. Software deconvolutes these charge states to determine the true molecular weight.
Both techniques can confirm peptide identity, but they have different strengths. MALDI-TOF is faster and more tolerant of sample impurities. ESI-MS often provides higher mass accuracy and can be coupled with liquid chromatography for additional separation before mass analysis. Many comprehensive testing laboratories use both techniques.
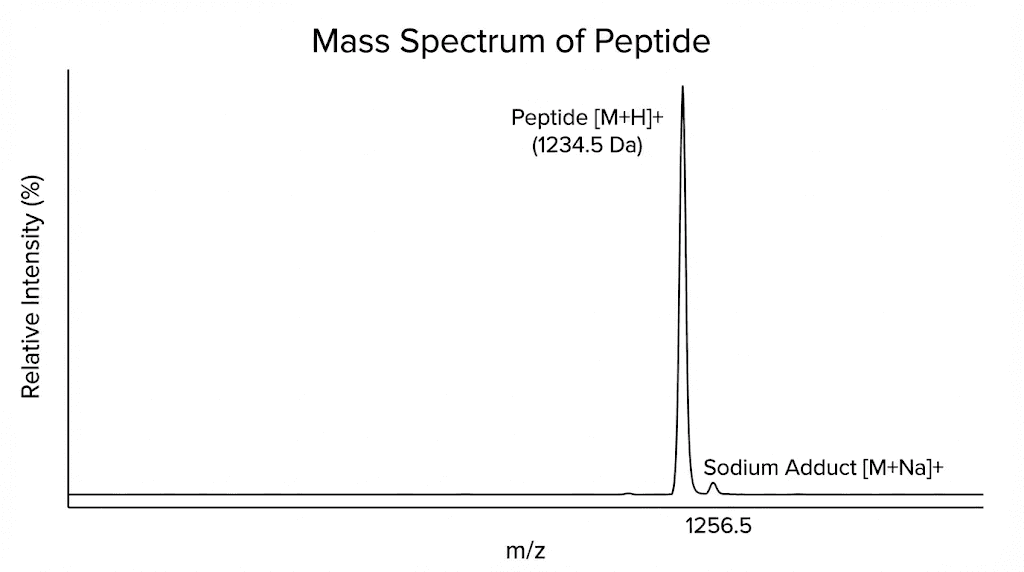
Interpreting mass spectrometry results
Your COA should report the observed molecular weight and the expected molecular weight for your peptide. These values should match within the instrument precision, typically within one Dalton for standard analyses or better than five parts per million for high resolution instruments.
When examining mass spectrometry results, look for the main peak corresponding to your target peptide. This peak should be the dominant signal. Smaller peaks may represent adducts, fragments, or impurities.
Common adducts include sodium and potassium additions. Instead of seeing only your peptide mass plus a proton, you might see peaks at the peptide mass plus 23 for sodium or plus 39 for potassium. These adducts are normal and do not indicate contamination. They result from trace metals present in solvents and glassware.
More concerning are peaks corresponding to deletion sequences or truncations. If your peptide should weigh 1500 Daltons but you see a strong peak at 1350 Daltons, something is wrong. That 150 Dalton difference might correspond to a missing amino acid. Perhaps the synthesis failed at one step, producing a peptide missing a single residue.
Oxidation products also appear in mass spectra.
Methionine containing peptides frequently show peaks at the target mass plus 16 Daltons, representing methionine sulfoxide formation. Tryptophan can also oxidize. Small amounts of oxidation are common and usually acceptable, but heavy oxidation suggests improper handling or storage.
When mass and purity disagree
Sometimes you encounter a puzzling situation. The HPLC shows 99% purity, but the mass spectrum shows multiple peaks. Or the mass spectrum shows a clean single peak, but the HPLC indicates only 90% purity. How do you reconcile these apparent contradictions?
HPLC purity and mass spectrometry results measure different things. HPLC separates based on how molecules interact with the column. Mass spectrometry distinguishes based on molecular weight. Two different compounds with identical molecular weights would appear as a single mass spectrometry peak but might separate in HPLC. Conversely, a peptide and its isomer with identical structure but different amino acid arrangement would have the same mass but might show as a single HPLC peak.
High HPLC purity with multiple mass spectrometry peaks might indicate that your main compound exists in multiple forms with similar chromatographic behavior. Deamidation products, for example, change the mass slightly but often co-elute with the parent peptide. The HPLC cannot separate them, so they appear as one peak with high purity. The mass spectrometer sees them as distinct species.
Low HPLC purity with a clean mass spectrum might indicate impurities that ionize poorly in the mass spectrometer. Some contaminants, particularly those from synthesis reagents or protecting groups, may not produce strong mass spectrometry signals. They affect the HPLC but remain invisible to mass spectrometry.
Neither situation is ideal. Both indicate something about your peptide that requires attention. When purity and identity results seem inconsistent, contact the vendor for clarification or consider additional testing.
Amino acid analysis and peptide content
Beyond purity and identity, some peptide report sheets include additional characterization data. Amino acid analysis and peptide content measurements provide deeper insight into what you actually have in your vial.
Amino acid analysis involves breaking down your peptide into individual amino acids and quantifying each one. This technique confirms that your peptide contains the expected residues in the expected ratios. It can detect substitutions, deletions, and other sequence errors that mass spectrometry might miss.
How amino acid analysis works
The peptide sample undergoes acid hydrolysis, typically with hydrochloric acid at elevated temperature for 24 hours or longer. This treatment breaks all peptide bonds, releasing free amino acids. These amino acids are then separated and quantified, usually by ion exchange chromatography or reversed phase HPLC with derivatization.
Each amino acid produces a characteristic response. By comparing the measured amounts to the expected amounts based on your peptide sequence, you can verify that the correct amino acids are present in the correct proportions.
Amino acid analysis has limitations. Some amino acids are destroyed during hydrolysis. Tryptophan is almost completely lost. Asparagine and glutamine are converted to aspartic acid and glutamic acid respectively. Cysteine requires special handling. These limitations mean the technique works best for verifying presence and approximate ratio rather than providing exact quantitation of every residue.
Despite these limitations, amino acid analysis catches problems that other methods miss. If your peptide synthesis accidentally incorporated the wrong amino acid at one position, the HPLC purity might still look fine and the mass might be close enough to appear correct. But amino acid analysis would reveal that you have too much of one amino acid and too little of another.
Understanding peptide content
Peptide content refers to the amount of actual peptide in your vial versus other materials like salts, moisture, and counterions. A vial labeled as containing 5 milligrams of peptide might actually contain only 3.5 milligrams of peptide along with 1.5 milligrams of trifluoroacetate counterion from the purification process plus absorbed moisture.
This distinction matters critically for dosing calculations. If you assume the vial contains 5 milligrams of peptide and calculate your concentrations accordingly, but only 3.5 milligrams is actually peptide, your working solutions will be 30% too dilute. Every experiment using those solutions will be affected.
Peptide content is typically determined by amino acid analysis, UV spectroscopy, or gravimetric methods combined with moisture and counterion analysis. The result is expressed as a percentage, often called peptide net content or peptide weight fraction.
Research grade peptides commonly have net peptide content between 60 and 85%. The remainder is typically counterion, usually trifluoroacetate or acetate, plus small amounts of moisture. Higher peptide content is achievable through salt exchange processes but adds cost.
When reconstituting peptides, account for peptide content in your calculations. If the COA indicates 70% peptide content and your vial is labeled as 5 milligrams, you have 3.5 milligrams of actual peptide. Your reconstitution math should use this corrected value.
Counterion considerations
Most synthetic peptides are supplied as salts. The counterion balances the positive charges on basic amino acid residues like lysine, arginine, and histidine. Trifluoroacetate, abbreviated TFA, is the most common counterion because it is a byproduct of the standard synthesis and purification process.
TFA counterions are generally acceptable for most research applications, but they can cause problems in specific situations. Some cell types are sensitive to residual TFA. Certain analytical techniques are affected by the strong TFA absorbance. If your application has counterion requirements, verify that your peptide meets them.
Acetate salt forms are available from many vendors as an alternative to TFA salts. The conversion adds processing cost but provides a more biocompatible counterion. Hydrochloride salts are another option. The choice of counterion affects both the peptide content percentage and the gross weight of material needed to achieve a given peptide amount.
Common impurities in synthetic peptides
Understanding what types of impurities might be present helps you interpret your peptide report sheet and assess potential impacts on your research. Peptide safety depends in part on knowing what contaminants could affect your experiments.
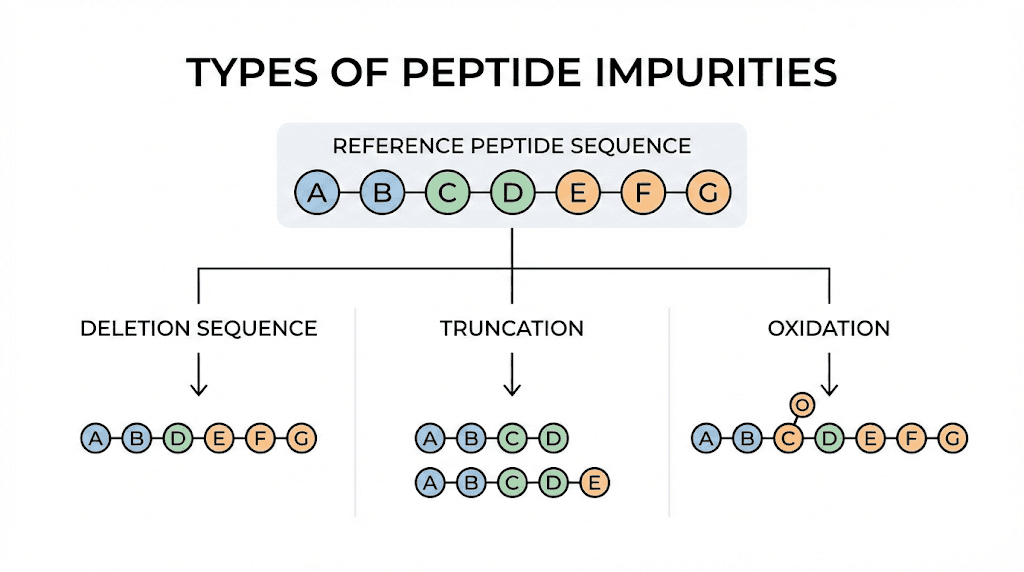
Deletion sequences
Deletion sequences are peptides missing one or more amino acids compared to the target sequence. They form when a coupling step in the synthesis fails to add the next amino acid.
The growing peptide chain continues to build, but it lacks one residue.
These impurities are problematic because they can have similar properties to the target peptide. A peptide missing a single glycine residue differs in mass by only 57 Daltons and may have very similar chromatographic behavior. Depending on which amino acid is missing, the deletion sequence might even retain some biological activity, confounding your experimental results.
HPLC can sometimes separate deletion sequences from the target, but not always. Mass spectrometry is more reliable for detecting them because the mass difference is characteristic. Look for peaks at your target mass minus the mass of individual amino acids. Common deletion masses include minus 57 for glycine, minus 71 for alanine, minus 87 for serine, and minus 97 for proline.
Truncated sequences
Truncated sequences are shortened versions of your peptide, typically missing several residues from one end. They can result from premature termination during synthesis or from degradation of the full length peptide.
N-terminal truncations form when synthesis stops before reaching the full sequence. The resulting peptide is correct from the C-terminus but ends prematurely. C-terminal truncations are less common but can occur if the peptide detaches from the synthesis resin before completion.
Truncated sequences are usually easier to separate from the full length peptide than single deletions because the mass difference is larger and chromatographic behavior differs more substantially. However, if present in significant amounts, they indicate synthesis problems that might affect overall quality.
Oxidation products
Oxidation affects certain amino acid side chains, particularly methionine, cysteine, and tryptophan. Methionine oxidation to methionine sulfoxide is the most common, adding 16 Daltons to the peptide mass. Further oxidation to methionine sulfone adds another 16 Daltons.
Small amounts of methionine oxidation are nearly unavoidable. Atmospheric oxygen is sufficient to cause gradual oxidation, especially in solution. The question is not whether oxidation exists but how much.
Highly oxidized peptides may have reduced biological activity.
The bulkier sulfoxide side chain can disrupt binding interactions that depend on the native methionine. If your peptide contains methionine at critical positions, monitoring oxidation status is important.
Cysteine oxidation leads to disulfide bond formation. Two cysteine residues can link together, either within the same peptide or between two separate peptides. Intramolecular disulfides change peptide conformation. Intermolecular disulfides create dimers that double the apparent molecular weight.
Proper peptide storage minimizes oxidation. Keep peptides in powder form under inert atmosphere when possible. Reconstituted solutions should be aliquoted and frozen. Avoid repeated freeze thaw cycles that expose the peptide to oxygen each time.
Deamidation products
Asparagine and glutamine residues can undergo deamidation, converting to aspartic acid and glutamic acid respectively. This modification adds one Dalton to the peptide mass and introduces a negative charge where there was none before.
Deamidation is particularly problematic for peptides containing asparagine followed by glycine. This NG sequence is a hotspot for rapid deamidation. If your target peptide contains this motif, expect some deamidation even in freshly prepared material.
The biological consequences of deamidation depend on the peptide and its application. In some cases, the modified peptide retains activity. In others, the activity is lost or altered. Knowing whether your peptide has undergone deamidation helps interpret experimental results.
Racemization
Racemization converts L-amino acids to their D-amino acid mirror images. This modification does not change the molecular weight but alters the peptide structure. Racemized peptides may have reduced or absent biological activity because most biological systems recognize only L-amino acid configurations.
Racemization is difficult to detect with standard mass spectrometry because the mass is unchanged. HPLC methods can sometimes resolve diastereomers formed by racemization, but specialized chiral analysis provides more definitive results.
Racemization occurs during synthesis, particularly at histidine residues and during certain coupling conditions. Quality manufacturers control synthesis parameters to minimize racemization. If you suspect racemization issues, ask the vendor about their synthesis protocols and quality control for this modification.
Proteomics report sheets and protein identification
Beyond synthetic peptide COAs, researchers also encounter proteomics report sheets from mass spectrometry based protein identification experiments.
These documents present a different type of information but follow related principles.
Proteomics analysis identifies proteins in complex biological samples by detecting their peptide fragments. The sample undergoes enzymatic digestion, typically with trypsin, breaking proteins into smaller peptides. These peptides are analyzed by liquid chromatography coupled to tandem mass spectrometry. Software matches the observed spectra to protein sequence databases, identifying which proteins were present.
Understanding protein identification reports
A proteomics report typically lists identified proteins along with supporting data. Key metrics include the number of unique peptides identified for each protein, sequence coverage percentage, and identification scores or probabilities.
The number of unique peptides provides confidence in the identification. Proteins identified by multiple peptides are more reliably identified than those supported by a single peptide. Single peptide identifications can be correct but carry higher uncertainty.
Sequence coverage indicates what fraction of the protein sequence was actually observed. High coverage provides strong evidence that the correct protein was identified. Low coverage might result from the protein being present at low abundance, from poor peptide ionization, or from sequence regions that do not produce detectable tryptic peptides.
Identification scores vary by software platform but generally represent some measure of confidence in the match between observed spectra and database sequences. Higher scores indicate better matches. Cutoff thresholds define what qualifies as a confident identification.
False discovery rate in proteomics
Large scale proteomics experiments identify thousands of peptides and hundreds or thousands of proteins. With so many identifications, some fraction will be incorrect, matching by chance rather than representing true detections. The false discovery rate, or FDR, estimates this fraction.
FDR is typically controlled at the peptide level and separately at the protein level. A 1% peptide FDR means approximately 1% of reported peptide identifications are expected to be false positives. However, protein level FDR can differ substantially from peptide level FDR.
This relationship between peptide FDR and protein FDR is complex. Because proteins are identified based on their constituent peptides, errors can propagate in non-obvious ways. A protein identified by many peptides with modest individual confidence might still be a confident identification overall, while a protein identified by a single high-scoring peptide might be less reliable.
When evaluating proteomics data, look for the FDR thresholds used and whether they apply at the peptide or protein level. Understand that stated FDR values are estimates based on statistical models, not absolute guarantees. Particularly important identifications may warrant additional validation.
Common software and database considerations
Proteomics identification depends on software and databases. Different search engines use different algorithms and may produce somewhat different results from the same data. Common platforms include MaxQuant, Mascot, Sequest, and various open source alternatives.
The protein sequence database searched determines what can be identified. Searching against a human protein database will only identify human proteins or close homologs. Proteins from other organisms, unusual variants, or contaminants might not match. Database choice should reflect your sample type and experimental goals.
Contaminant databases are often searched alongside the target organism database. Common contaminants include keratins from skin, trypsin from the digestion enzyme, and bovine serum albumin from cell culture media. Identifying these contaminants is important for assessing sample quality.
Evaluating peptide vendor documentation
Not all COAs are created equal. Learning to evaluate documentation quality helps you assess vendor reliability and make informed purchasing decisions. The vendor selection process should include careful review of their analytical documentation.
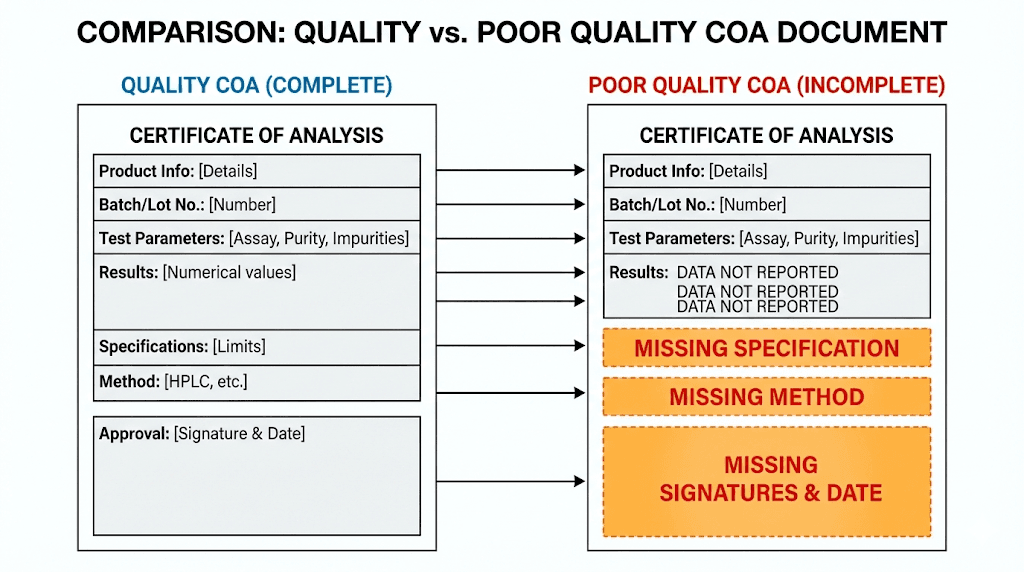
Red flags in peptide documentation
Certain characteristics of COAs should raise concerns. Missing lot numbers top the list. Without a lot number, you cannot verify that the COA corresponds to your specific product. Generic COAs recycled for multiple batches indicate inadequate quality control.
Perfectly round purity numbers should prompt skepticism. Real analytical results include decimal places and variation. If every peptide from a vendor shows exactly 99.0% purity, someone is likely fabricating numbers rather than performing real analysis.
Missing chromatograms or spectra limit your ability to verify results. The actual data is more valuable than just the reported numbers. Quality vendors provide graphical data showing their analytical results, not just summary values.
Absent laboratory identification or analyst signatures suggest the document may not represent actual testing. Legitimate analytical laboratories identify themselves and have qualified personnel responsible for results.
No method information makes results hard to interpret. What column was used? What gradient? What mass spectrometer? Without this information, you cannot assess whether the analysis was appropriate or compare results across vendors.
What good documentation looks like
Quality COAs include complete identifying information linking the document to your specific batch.
They provide both summary results and supporting raw data. Method descriptions explain how the analysis was performed. Laboratory credentials and analyst identification establish accountability.
The best vendors go beyond minimum requirements. They might include stability data showing how the peptide behaves over time. They might provide multiple analytical techniques that cross-validate each other. They might offer to answer technical questions about their results.
Third party verification adds another layer of confidence. If a vendor routinely submits products to independent laboratories and makes those results available, you have assurance that goes beyond self-reported data.
Questions to ask vendors
Do not hesitate to engage vendors about their quality documentation. Legitimate suppliers welcome quality-focused customers. Vendors who become evasive when questioned about their COAs are telling you something important.
Ask what testing is performed on each batch. Is it comprehensive or just spot checking? Ask who performs the testing. In house, third party, or both? Ask about their specifications. What purity level must a product meet before shipping?
Ask about handling failures. What happens to batches that do not meet specifications? Are they discarded, reworked, or sold at lower grades? Ask about stability. How long is the peptide expected to remain stable under recommended storage conditions?
Ask for method details if they are not on the COA. Request chromatograms if only summary data is provided. Ask about experience with your specific peptide if it presents any synthesis challenges.
The answers, and how willingly they are provided, reveal much about vendor quality and transparency. SeekPeptides maintains information about vendor reliability and can help members navigate these assessments.
Practical application: reading your COA step by step
Theory provides foundation, but practical application matters most. Here is a systematic approach to evaluating the peptide documentation you receive with your orders.
Step one: verify basic information
Start with the basics before examining analytical data. Check that the peptide name or sequence on the COA matches what you ordered. Verify the lot number corresponds to the number on your vial label. Confirm the document appears current with a recent testing date.
If any basic information is missing or does not match, stop and contact the vendor before using the product. These foundational elements must be correct before proceeding.
Step two: examine purity data
Look at the HPLC purity result.
Is it above your minimum acceptable threshold for your application? Note the method used if provided. Is it a standard reversed phase method at 214 nm, or something different?
If a chromatogram is included, examine the peak shape. Your main peptide should produce a sharp, symmetrical peak. Broad or tailing peaks might indicate heterogeneity. Multiple peaks obviously indicate impurities, but even a single peak with poor shape warrants attention.
Check for reported impurities. Some COAs quantify individual impurity peaks. Are any specific impurities called out? Do their characteristics suggest what they might be?
Step three: verify identity
Examine the mass spectrometry results. Calculate the expected molecular weight for your peptide if you have not already. Does the observed mass match within appropriate tolerance?
Look for adduct peaks at expected positions. Sodium and potassium adducts are normal. Look for oxidation at plus 16 or plus 32 from your target mass. Significant oxidation peaks indicate potential issues.
Check for deletion masses. Calculate what your peptide mass would be minus each amino acid residue. Are there peaks at those masses? Significant deletion peaks indicate synthesis problems.
If a mass spectrum is included, examine the isotope pattern. Peptides produce characteristic patterns of peaks separated by one mass unit, reflecting the natural isotope distribution. The pattern should be clean and match theoretical predictions.
Step four: check additional data
If amino acid analysis is provided, verify the ratios match your expected sequence. The values will not be exact due to analytical limitations, but they should be close.
Note the peptide content if reported. Use this value for accurate concentration calculations rather than assuming the label weight is all peptide.
Check any other data provided, such as solubility, appearance, or stability information. These details help you handle the peptide appropriately.
Step five: assess overall quality
Step back and evaluate the complete picture. Does everything look consistent? High HPLC purity with clean mass spectrometry and appropriate amino acid composition indicates quality product. Any discrepancies between measurements warrant investigation.
Compare the quality level to your application requirements. Research requiring precise quantitation needs high purity and well-characterized peptide content. Preliminary screening experiments may be more tolerant of impurities.
Document your assessment. Note any concerns for future reference. If you encounter experimental problems later, your COA evaluation notes may help identify peptide quality as a potential cause.
How storage and handling affect peptide quality
A perfect COA represents your peptide at the time of testing. What happens after testing depends on storage and handling. Understanding degradation pathways helps you maintain quality from receipt through use.
Temperature effects
Most peptides are stable for extended periods when stored as dry powders at low temperature. Freezer storage at minus 20 degrees Celsius or colder is standard for long term keeping. Many peptides remain stable for years under these conditions.
Refrigerator storage at 2 to 8 degrees Celsius is acceptable for shorter periods, typically weeks to a few months depending on the peptide. Room temperature storage accelerates degradation and should generally be avoided except for immediate use.
The question of how long peptides last at room temperature depends on the specific sequence. Stable sequences might tolerate days to weeks. Sensitive sequences might degrade significantly within hours. When in doubt, keep it cold.
Moisture and oxygen
Water and oxygen are enemies of peptide stability. Moisture promotes hydrolysis reactions that break peptide bonds. Oxygen drives oxidation of sensitive amino acids.
Lyophilized peptides should be protected from moisture uptake. Store them in tightly sealed containers, ideally with desiccant. Allow vials to warm to room temperature before opening to prevent condensation from moist air contacting the cold powder.
Inert atmosphere storage provides additional protection. Some vendors ship peptides under nitrogen or argon. When transferring peptides or aliquoting, minimizing air exposure helps maintain quality.
Solution stability
Reconstituted peptides generally have shorter stability than dry powders. The question of how long reconstituted peptides last depends on the solvent, concentration, temperature, and peptide sequence.
Aqueous solutions at neutral pH are most susceptible to degradation. Acidic solutions often provide better stability. Many peptides are reconstituted in dilute acetic acid or acidified water for this reason.
Frozen solutions are more stable than refrigerated solutions. Aliquoting reconstituted peptides into single use portions and freezing them minimizes degradation from repeated freeze thaw cycles.
Some peptides have specific stability concerns. Cysteine containing peptides may form unwanted disulfide bonds. Methionine containing peptides may oxidize. Asparagine containing peptides may deamidate. Knowing your peptide sequence helps you anticipate and prevent degradation.
When to retest
Peptides stored for extended periods or under suboptimal conditions may warrant retesting before use in critical experiments. If you have concerns about storage history, analytical testing can verify current quality.
Signs suggesting degradation include changes in appearance, difficulty reconstituting, or unexpected experimental results. If your peptide powder has changed color or clumped, something may have happened. If solutions that previously dissolved cleanly now precipitate, degradation might be occurring.
Retesting does not have to be comprehensive. A simple HPLC purity check can detect major degradation. If purity has dropped significantly from the original COA, the peptide should be replaced.
Advanced topics in peptide analysis
Beyond standard COA interpretation, several advanced analytical topics may be relevant for specialized applications.
Sequence verification methods
Standard mass spectrometry confirms total molecular weight but does not directly verify the amino acid sequence. For applications requiring absolute sequence confidence, additional techniques are available.
Tandem mass spectrometry, or MS/MS, fragments peptides and analyzes the resulting pieces. The fragmentation pattern reveals sequence information. By matching observed fragment masses to predicted fragment masses, the complete sequence can be verified.
Edman degradation provides another approach to sequence verification. This classical technique removes amino acids one at a time from the N-terminus, identifying each in turn. Modern implementation is automated and can sequence peptides up to about 50 residues.
For most research applications, the combination of molecular weight confirmation and HPLC purity is sufficient. Comprehensive sequence verification adds cost and is typically reserved for critical applications or when synthesis of difficult sequences raises concerns.
Capillary electrophoresis
Capillary electrophoresis, or CE, separates peptides based on charge and size rather than hydrophobicity. This technique provides orthogonal information to reversed phase HPLC, potentially resolving impurities that co-elute in HPLC.
CE is particularly useful for analyzing peptides with multiple charged groups, such as those containing several lysine or arginine residues. It can also detect deamidation products that introduce charge differences without substantially changing hydrophobicity.
Not all COAs include CE data, but for specialized applications or when HPLC results seem incomplete, requesting CE analysis may provide additional quality assurance.
Circular dichroism
Some peptides adopt specific secondary structures, such as alpha helices or beta sheets. Circular dichroism, or CD, spectroscopy can characterize these structures, verifying that your peptide folds correctly.
CD is most relevant for peptides designed to have particular conformations, such as antimicrobial peptides with helical structures or peptides intended to mimic protein domains. For flexible peptides without defined structure, CD provides limited information.
Bioactivity assays
Analytical purity does not guarantee biological activity.
A peptide can be 99% pure by HPLC and have the correct mass but still fail in biological assays. This might happen if the peptide has racemized, adopted an incorrect conformation, or contains a subtle modification not detected by standard methods.
For critical applications, bioactivity testing provides the ultimate quality verification. The specific assay depends on the peptide's intended function. Receptor binding assays, cell based assays, or in vivo studies may be appropriate depending on the peptide and application.
Bioactivity testing is not routine for research grade peptides due to cost and complexity. However, if you are experiencing unexpected results with peptides that appear analytically acceptable, requesting or performing bioactivity verification may resolve the mystery.
Troubleshooting unexpected results
Sometimes experiments fail despite using peptides with acceptable COAs. Systematic troubleshooting can identify whether peptide quality is the cause or whether other factors are responsible.
When to suspect peptide problems
Consider peptide quality as a potential issue when results are inconsistent between batches, when positive controls fail, when expected activities are absent or weaker than anticipated, or when unexpected side activities appear.
Batch to batch variability is particularly telling. If results with one lot of peptide differ from results with another lot of the same peptide, something about the peptides differs. Reviewing COAs for both batches may reveal differences in purity, identity, or other parameters.
Positive control failures are another red flag. If your experimental system has always worked with this peptide but suddenly stops working, the new batch of peptide is an obvious suspect. Compare the new COA to previous COAs for any differences.
Comparison to reference standards
Reference standards provide a benchmark for comparison.
If you have a known-good peptide sample that consistently performs as expected, testing new batches against this reference can reveal quality issues.
Reference standards should be stored under optimal conditions and used before their stability limit. A degraded reference standard defeats the purpose of comparison testing.
Some peptides have commercially available reference standards with certified values. Using these standards, when available, provides maximum confidence in your comparison testing.
Requesting additional testing
If standard COA data does not explain your experimental problems, consider requesting additional analysis. The vendor may be able to perform supplementary tests, or you can submit samples to an independent analytical laboratory.
Describe your concerns specifically when requesting additional testing. If you suspect oxidation, ask for oxidation-specific analysis. If you suspect the sequence is wrong, ask for sequence verification. Targeted testing is more likely to identify problems than generic retesting.
Document your troubleshooting process thoroughly. This documentation helps vendors understand your concerns and helps you track patterns across multiple peptide purchases.
Building a quality control workflow
Rather than treating COA review as an afterthought, incorporate it into a systematic quality control workflow. This approach catches problems early and maintains consistent quality across your research program.
Receiving inspection
When peptides arrive, immediately inspect the package and documentation. Verify the product matches your order. Check that the COA is present and corresponds to the received lot number.
Store the peptide appropriately based on vendor instructions and your storage capabilities.
Document receipt including date, condition of packaging, and any observations about the product.
Review the COA using the systematic approach described earlier. Note any concerns or questions. If issues are identified, contact the vendor promptly. Most vendors have return or replacement policies for products that do not meet specifications.
Pre-use verification
Before using a peptide in experiments, verify it remains suitable. If the peptide has been stored for an extended period, check that it still appears normal. Consider retesting if storage conditions were suboptimal or if the time since receipt is long.
For critical experiments, consider running a small pilot study before committing full resources. This verification step can identify problems before they waste expensive reagents and researcher time.
Documentation and trending
Maintain records of all peptides purchased, their COA data, storage conditions, and experimental performance. This documentation enables trending over time, identifying patterns that might indicate vendor quality changes or storage issues.
If you consistently purchase the same peptides, comparison across batches can reveal lot-to-lot variability. Some variability is normal, but excessive variability suggests quality control problems at the manufacturer.
Documentation also supports troubleshooting. When experiments fail, historical records help identify whether peptide quality might be responsible. Without documentation, you are left guessing.
SeekPeptides provides members with resources for establishing quality control workflows tailored to their research needs. Effective quality control prevents wasted time and money while improving experimental reliability.
Frequently asked questions
What purity level do I need for my research?
The required purity depends on your specific application. For most cell culture and binding studies, 95% purity is typically sufficient. Quantitative studies requiring precise concentration calculations benefit from 98% or higher purity. Preliminary screening experiments may tolerate lower purity. When in doubt, higher purity reduces variables that might confound your results. Review your experimental design and consider how impurities might affect your specific assays.
Why does my mass spectrometry result show peaks at different masses than expected?
Several explanations exist for unexpected mass peaks. Sodium and potassium adducts add 22 or 38 mass units respectively and are common. Oxidation adds 16 mass units per modification. Deamidation adds 1 mass unit. Deletion of amino acids produces peaks at your target mass minus the specific amino acid mass. If peaks do not fit these common patterns, contact the vendor for clarification about what might be present.
How can I tell if a COA is fake?
Fake COAs often have telltale signs. Look for missing lot numbers, generic templates that appear recycled across products, absence of actual chromatograms or spectra, perfectly round purity numbers lacking decimal precision, no laboratory identification or analyst signatures, and missing method details. When multiple red flags are present, the COA may not represent actual testing. Request additional documentation or consider a different vendor.
Should I always request third party testing?
Third party testing provides additional confidence but adds cost. For routine research applications with established vendors, in house COAs from reputable manufacturers are generally acceptable. For critical applications, novel peptides, or work with unfamiliar vendors, third party verification provides valuable independent confirmation. Your decision should balance the importance of the research against the additional cost and time required for third party testing.
What should I do if my peptide does not perform as expected?
Start by reviewing the COA for any issues you might have initially overlooked. Compare to COAs from previous successful batches if available. Check your storage and handling procedures. Consider whether other experimental variables might be responsible. If peptide quality remains suspected, contact the vendor with your concerns.
Request additional testing or a replacement batch. Document everything for future reference and troubleshooting.
How long are peptides stable after reconstitution?
Reconstituted peptide stability varies by sequence, solvent, concentration, and storage temperature. As a general guideline, most peptides remain stable for at least one week refrigerated and several months frozen. Acidified solutions typically provide better stability than neutral aqueous solutions. Peptides containing oxidation-sensitive residues or deamidation-prone sequences may degrade faster. For maximum stability, prepare small aliquots, freeze them, and thaw each only once before use. Check specific guidance for reconstituted peptide storage based on your peptide sequence.
External resources
In case I do not see you, good afternoon, good evening, and good night. Join us.