Jan 6, 2026

Understanding peptide elution time and intensity heatmaps represents essential skill for verifying peptide quality given the research chemical market's lack of regulatory oversight creating opportunities for vendors providing inaccurate purity claims or selling contaminated products.
Reading analytical outputs requires understanding fundamental separation principles underlying peptide testing methods. HPLC separates compounds based on interactions with stationary phase (column packing material) and mobile phase (solvent flowing through column), hydrophobic peptides binding column more strongly eluting later while hydrophilic peptides passing through quickly appearing at early retention times. Peak intensity (detector signal strength measured in milliabsorbance units, mAU) correlates with peptide concentration in sample allowing quantification through peak area integration compared to standards.
Impurities showing as separate peaks reveal synthesis byproducts (truncated sequences, deletion peptides, missed couplings), degradation products (oxidized methionine, deamidated asparagine), or contaminants (salts, solvents, other peptides). SeekPeptides helps users developing analytical literacy for informed purchasing decisions.
Certificate of Analysis (COA) interpretation depends on chromatogram reading skills since vendors can manipulate or misrepresent data when customers lack analytical knowledge. Legitimate COAs include actual chromatogram images showing raw data (peaks, baselines, retention times), integration results calculating peak areas and purity percentages, method parameters (column type, mobile phase, gradient program, detection wavelength), and sample identification linking specific batches to testing.
Fake or misleading COAs might show only purity numbers without supporting chromatograms, impossibly perfect results (exactly 99.9% with zero impurities detected), generic chromatograms not matching your batch, or inconsistent data (claimed purity not matching visible peak areas). Learning to spot these red flags through chromatogram analysis protects against low-quality or fake products. Vendor verification requires combining COA scrutiny with independent testing confirmation.
This comprehensive guide covers HPLC fundamentals and separation principles, understanding chromatogram components (retention time, peak shape, baseline, integration), interpreting peak intensity and area calculations for purity determination, reading heatmap visualizations for batch consistency and stability assessment, identifying common impurity patterns and degradation signals, comparing theoretical versus actual retention times, evaluating method parameters and their impact on results, practical COA analysis and red flag detection, troubleshooting anomalous results and understanding artifacts, and applying chromatogram reading to informed peptide purchasing decisions. SeekPeptides serves as trusted resource for peptide analytical education supporting quality verification.
Let's begin with HPLC fundamentals to understand what chromatograms represent.
HPLC fundamentals and separation principles
Understanding the analytical method creates foundation for interpreting results.
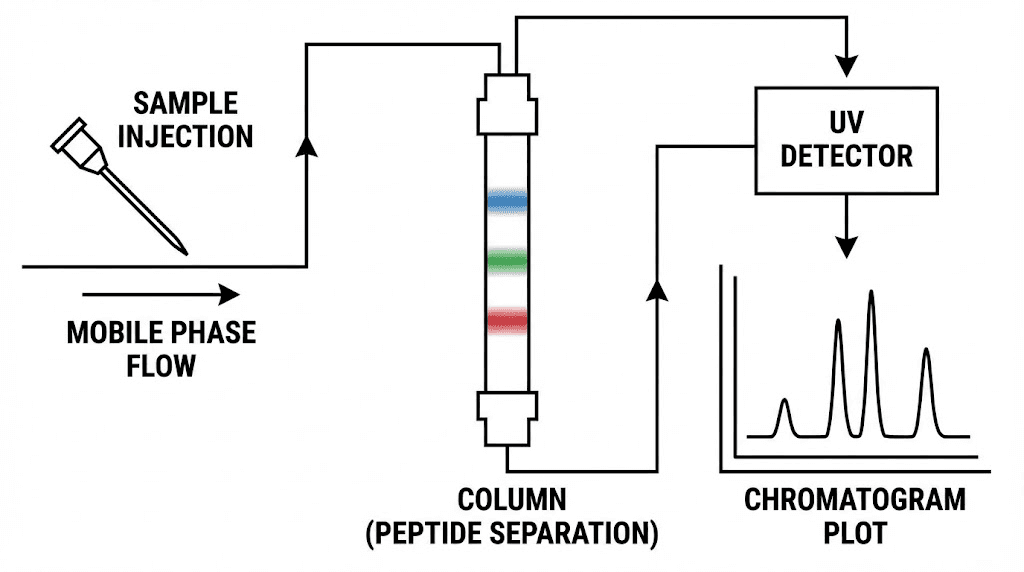
Basic HPLC components and workflow
Sample injection: Dissolved peptide sample (typically 0.1-1 mg/mL in appropriate solvent) injected into flowing mobile phase. Injection volumes small (5-20 microliters) preventing column overload. Autosampler allows sequential analysis of multiple samples maintaining consistent injection parameters.
Column separation: Sample flows through column packed with stationary phase particles (typically 3-5 micrometer silica beads with bonded C18 alkyl chains for reverse-phase chromatography most common for peptides). Compounds interact differently with stationary phase based on hydrophobicity, size, and charge separating as they travel through column.
Gradient elution: Mobile phase composition changes over time (gradient program) typically starting with high aqueous content (water with acid modifier) gradually increasing organic solvent (acetonitrile or methanol) percentage. Hydrophobic peptides eluting as organic content increases providing sufficient solvation overcoming stationary phase binding.
Detection: As separated compounds exit column, UV detector measures absorbance at specific wavelength (typically 214nm or 220nm for peptide bond absorbance). Detector signal (absorbance in mAU) plotted versus time creating chromatogram. Peak appears when compound concentration high at detector, baseline signal when only mobile phase present.
Data processing: Software integrates peaks (calculates area under curve), identifies retention times (time from injection to peak maximum), calculates relative percentages (each peak area divided by total area), and generates reports. Chromatogram represents visual output showing separation quality and compound purity. Understanding HPLC methodology essential for result interpretation.
Reverse-phase chromatography for peptides
Stationary phase: C18 (octadecyl) bonded silica most common for peptide analysis. Provides hydrophobic surface interacting with nonpolar amino acid sidechains (leucine, isoleucine, phenylalanine, tryptophan, valine). C8 (octyl) or C4 (butyl) phases also used, shorter chains providing less retention for very hydrophobic peptides.
Mobile phase: Aqueous component typically water with 0.1% trifluoroacetic acid (TFA) providing low pH (around 2) suppressing peptide ionization and improving peak shape. Organic component acetonitrile or methanol providing peptide solvation. Gradient program increases organic percentage (typically 5% to 95% over 20-60 minutes) eluting peptides based on hydrophobicity.
Retention mechanism: Hydrophobic peptide regions bind stationary phase through van der Waals interactions. As organic solvent percentage increases, provides better solvation of hydrophobic regions weakening stationary phase binding allowing peptide elution. More hydrophobic peptides require higher organic content for elution appearing later in chromatogram.
Selectivity factors: Peptide sequence determines hydrophobicity and thus retention time. Single amino acid changes can substantially alter retention. Temperature affects retention (higher temperature generally decreases retention). Flow rate impacts resolution (slower flow improves separation but lengthens analysis time). Understanding these factors helps predicting expected retention times and identifying anomalies. Peptide chemistry determines chromatographic behavior.
Ion-exchange and other chromatography modes
Cation-exchange chromatography: Positively charged peptides (basic amino acids lysine, arginine, histidine) binding negatively charged stationary phase. Salt gradient (increasing ionic strength) eluting peptides. Useful for separating peptides differing in charge but similar hydrophobicity. Less common than reverse-phase for routine purity analysis but valuable for specific applications.
Anion-exchange chromatography: Negatively charged peptides (acidic amino acids aspartic acid, glutamic acid) binding positively charged stationary phase. Again salt gradient for elution. Complementary to cation exchange for peptides with net negative charge.
Size-exclusion chromatography: Separating peptides by molecular weight, larger molecules excluded from porous stationary phase eluting first while smaller molecules penetrating pores eluting later. Limited resolution for peptides unless substantial size differences. More common for protein analysis.
Hydrophilic interaction chromatography (HILIC): Polar stationary phase retaining hydrophilic compounds. Organic-rich mobile phase with increasing water content for elution. Opposite retention order versus reverse-phase. Useful for very hydrophilic peptides poorly retained on C18 columns.
Method selection: Reverse-phase chromatography remains standard for peptide purity analysis due to excellent resolution, compatibility with mass spectrometry, and general applicability across diverse peptide sequences. Vendor COAs almost universally use reverse-phase HPLC. Other modes specialized for particular problems. Analytical method selection depends on peptide properties and analytical goals.
Understanding chromatogram components
Chromatograms contain multiple information-rich elements requiring systematic interpretation.
Retention time and peak identification
X-axis (time): Horizontal axis represents time from sample injection in minutes. Typical peptide analyses run 10-60 minutes depending on gradient length and column dimensions. Longer gradients provide better resolution (peak separation) but extend analysis time.
Retention time (Rt): Time from injection to peak maximum, expressed in minutes. Characteristic for specific peptide under defined conditions (column, mobile phase, temperature, flow rate). BPC-157 might elute at 25.3 minutes while TB-500 appears at different time based on sequence differences affecting hydrophobicity.
Peak identification: Expected retention time for target peptide determined through preliminary method development or literature values. Peak appearing at expected time likely represents desired peptide though confirmation requires mass spectrometry (MS). Unexpected peaks at different times indicate impurities requiring investigation.
Retention time precision: Well-maintained HPLC systems show excellent retention time reproducibility, typically ±0.1-0.2 minutes variation between injections. Larger variations suggest system problems (pump inconsistency, temperature fluctuations, column degradation). Retention time shifts over time expected as column ages, periodic recalibration necessary.
Void volume peak: Small peak appearing very early (typically 1-3 minutes) represents unretained material passing through column without interaction. Includes salts, buffers, or very hydrophilic compounds. Normal observation not indicating impurity if well-separated from peptide peak.
Peak height and area
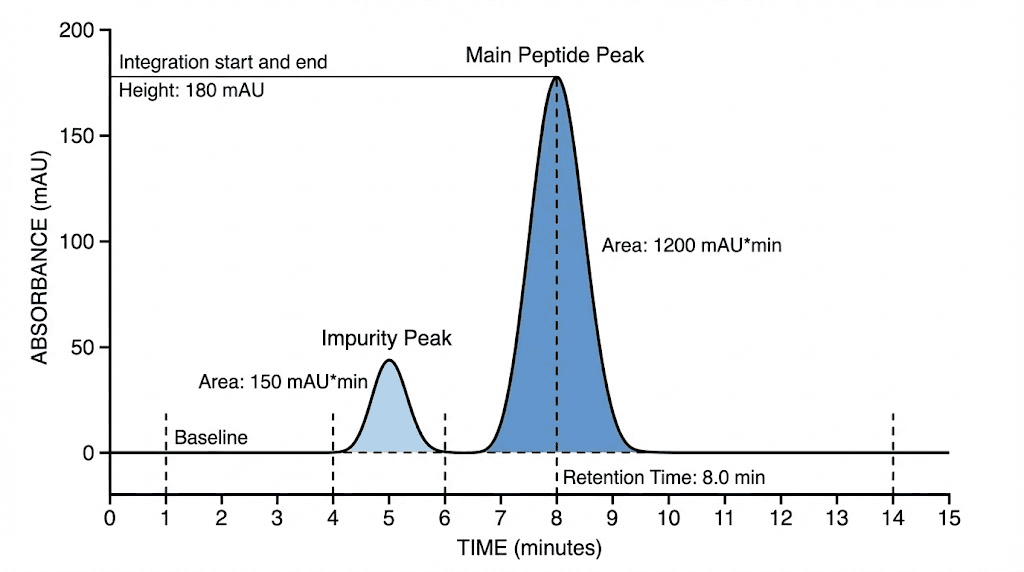
Y-axis (absorbance): Vertical axis represents detector signal in milliabsorbance units (mAU). Measures UV light absorbed by compounds passing through detector cell. Peptide bonds absorb strongly at 214-220nm providing sensitive detection. Higher peptide concentration produces greater absorbance and taller peaks.
Peak height: Maximum absorbance value at peak apex. Indicates instantaneous concentration at detector when highest amount of compound present. Height sensitive to peak width, broader peaks showing lower heights for same amount of material.
Peak area: Total area under peak curve calculated through integration. Represents total quantity of compound in peak accounting for peak height and width. More accurate quantification measure than height especially when peak shapes vary. Software automatically integrates peaks calculating areas.
Area percentage: Each peak area divided by sum of all peak areas, expressed as percentage. Primary peptide peak area percentage equals purity. Impurity peaks shown as individual percentages. Sum of all percentages equals 100%. Most vendor COAs report purity as primary peak area percentage.
Concentration determination: Comparing sample peak area to standard curve (known concentrations analyzed) allows calculating peptide concentration. However, purity assessment only requires relative percentages not absolute concentrations. Understanding peak integration critical for accurate purity calculation.
Baseline and signal quality
Baseline: Detector signal when only mobile phase present, ideally flat horizontal line near zero absorbance. Represents background signal from mobile phase UV absorbance and detector noise. Stable baseline essential for accurate peak integration.
Baseline drift: Gradual upward or downward baseline slope over analysis. Common with gradient elution as organic solvent percentage increases (acetonitrile absorbs less UV than water creating downward drift). Modern software compensates through baseline correction algorithms. Excessive drift indicates lamp aging or other system issues.
Baseline noise: Random signal fluctuations around baseline. Quantified as peak-to-peak noise amplitude. Lower noise improves limit of detection (smallest peak detectable above noise).
Typical well-maintained systems show noise below 0.5 mAU. Excessive noise suggests detector problems or contaminated mobile phase.
Signal-to-noise ratio: Peak height divided by baseline noise level. Higher ratios indicate clearer detection. Ratio above 3:1 considered limit of detection, above 10:1 for reliable quantification. Major peptide peak typically shows ratio 50:1 to 500:1. Small impurity peaks might have lower ratios affecting detection confidence.
Baseline correction: Software adjusts integration baseline accounting for drift ensuring accurate peak area calculation. Manual baseline adjustment sometimes necessary for complex chromatograms with overlapping peaks or unusual baseline behavior. Understanding baseline issues prevents misinterpreting artifacts as impurities. Chromatogram quality assessment identifies technical problems affecting results.
Peak shape and resolution
Gaussian peaks: Ideal peak shows symmetrical Gaussian (bell curve) shape with smooth rise to apex and symmetrical descent. Indicates efficient chromatography with compound molecules experiencing similar retention and eluting together. Most peptide peaks approximate Gaussian shape.
Peak tailing: Asymmetrical peak with extended tail on right side (later elution times). Indicates secondary interactions (ionic interactions with residual silanol groups on stationary phase) or column overload. Moderate tailing common for basic peptides, excessive tailing suggests method optimization needed or column deterioration.
Peak fronting: Asymmetrical peak with extended tail on left side (earlier elution times). Less common than tailing, indicates column overload (too much sample injected) or stationary phase problems. Generally undesirable requiring method adjustment.
Peak width: Time duration of peak at base. Narrow peaks indicate efficient separation and concentrated elution bands. Broad peaks suggest poor chromatographic efficiency. Width affected by column efficiency, flow rate, gradient steepness, and sample injection volume.
Resolution: Degree of separation between adjacent peaks. Quantified as Rs = 2(Rt2 - Rt1)/(w1 + w2) where Rt represents retention times and w represents peak widths. Resolution above 1.5 considered baseline separated, 1.0-1.5 partially separated, below 1.0 poorly resolved. Good resolution essential for accurate purity assessment preventing impurity peaks hiding under main peak.
Interpreting peak intensity and purity calculations
Converting raw chromatogram data into meaningful purity assessment.
Integration methods and area calculation
Peak detection threshold: Software identifies peaks exceeding threshold signal above baseline (typically 5-10x noise level). Prevents integrating baseline noise as peaks. Threshold too low creates false peaks, too high misses small impurities. Proper threshold setting critical for accurate purity.
Integration boundaries: Software determines peak start and end points (typically where signal returns near baseline). Draws integration baseline between these points (usually straight line). Calculates area between peak curve and integration baseline. Challenging for overlapping peaks requiring manual adjustment or advanced algorithms.
Tangent skimming: For overlapping peaks, draws perpendicular line from valley between peaks to integration baseline. Separates peak areas for independent quantification. Alternative methods include Gaussian deconvolution mathematically fitting overlapping peaks.
Manual integration: Analyst can override automatic integration for problematic peaks. Adjusts integration boundaries, baseline placement, or separation of overlapping peaks. Required for unusual peak shapes, baseline disturbances, or closely eluting compounds. Manual intervention introduces subjective element potentially affecting purity calculation.
Valley-to-valley integration: Alternative approach integrating entire peak cluster as single area then subdividing based on local minima. Reduces baseline dependency but may not accurately reflect individual compound quantities. Method choice affects final purity numbers especially for samples with multiple impurities. Understanding integration strategies reveals potential manipulation points in vendor COAs.
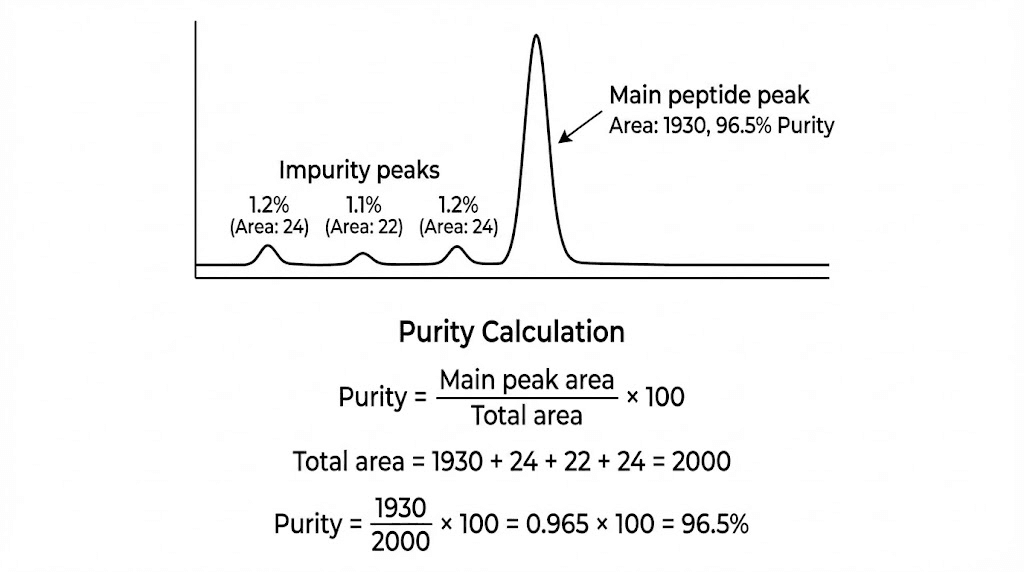
Calculating purity from peak areas
Area percentage formula: Purity % = (Main peak area / Sum of all peak areas) × 100. Simple calculation assuming all compounds show similar detector response (absorbance per unit concentration). Reasonable assumption for structurally similar peptides but inaccurate for very different compounds.
Extinction coefficient considerations: Different peptides absorb UV light differently based on aromatic amino acid content (tryptophan absorbs most strongly, tyrosine moderately, phenylalanine weakly). Peptides rich in aromatic residues show stronger absorbance per unit concentration than those without. Purity calculation by area percentage assumes similar absorbance characteristics.
Correction factors: For known impurities with characterized structures, can apply correction factors accounting for different extinction coefficients. Rarely done in routine purity analysis, mentioned for completeness. Standard area percentage purity acceptable approximation for most applications.
Detection wavelength impact: Measuring at 214-220nm detects peptide bonds present in all peptides providing general applicability. Alternative wavelengths (254nm for aromatic absorbance, 280nm for tryptophan/tyrosine) show different relative responses potentially affecting calculated purities. COAs should specify wavelength allowing proper interpretation.
Acceptance criteria: Research-grade peptides typically 90-95%+ purity, pharmaceutical-grade 98-99%+. Exact threshold depends on application. Therapeutic use demands highest purity. Research allowing broader range accepts lower percentages. Understanding purity requirements guides vendor selection and quality expectations. Purity standards vary by application.
Impurity quantification and identification
Individual impurity percentages: Each impurity peak area divided by total area gives individual impurity percentage. Major impurities (>1-2%) warrant investigation. Minor impurities (<1%) generally acceptable though total should remain low (<5%).
Impurity patterns: Multiple small impurity peaks might indicate incomplete purification during synthesis. Single large impurity suggests specific synthesis problem or degradation product. Pattern provides clues about impurity origin guiding corrective actions.
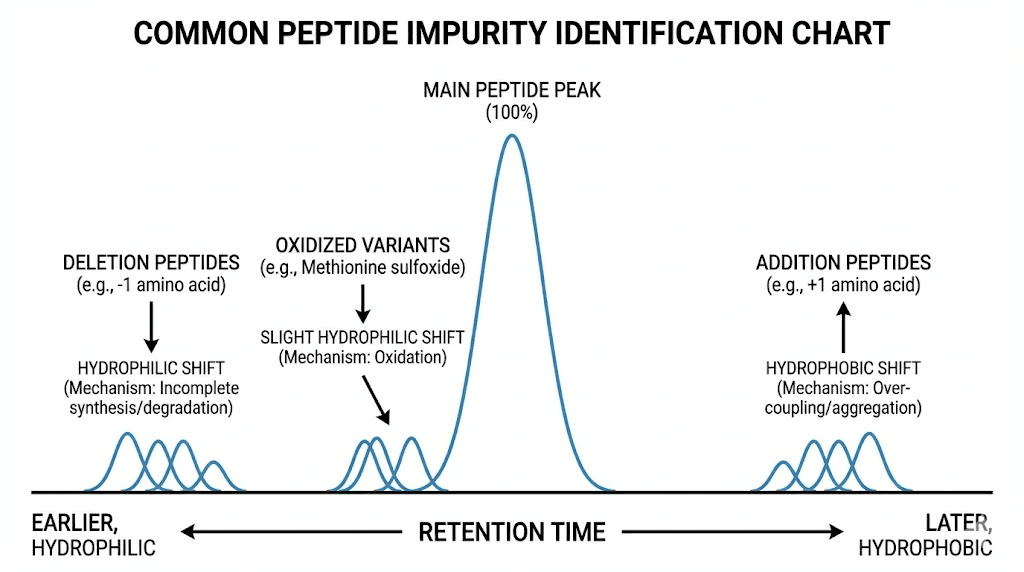
Retention time analysis: Impurity eluting slightly before main peak (earlier retention time) likely deletion peptide (missing amino acid) being less hydrophobic. Impurity eluting slightly after (later retention time) possibly addition peptide (extra amino acid) or modified peptide (acetylated, formylated) being more hydrophobic.
Mass spectrometry identification: HPLC-MS coupling allows identifying impurities through molecular weight determination. Peak with mass 1 Da lower than target suggests deamidation (asparagine to aspartic acid). Mass 16 Da higher indicates oxidation (methionine to methionine sulfoxide). Definitive identification requires MS though HPLC alone provides valuable screening.
Peptide-specific impurities: BPC-157 impurities differ from TB-500 impurities based on sequence and synthesis methods. Experience with specific peptides helps recognizing typical impurity profiles distinguishing normal from concerning patterns.
Method validation and reference standards
Reference standard analysis: Analyzing certified reference standard (known purity peptide) establishes expected chromatogram appearance, retention time, and peak shape. Comparing sample to reference confirms identity and quantifies purity accurately.
System suitability testing: Before analyzing samples, inject standard solution verifying system performance (retention time reproducibility, peak shape, resolution between known compounds). Failing system suitability indicates problems requiring correction before accepting sample results.
Method qualification: Pharmaceutical applications require extensive method validation documenting accuracy, precision, linearity, specificity, and robustness. Research chemical vendors rarely perform such rigorous validation. Understanding validation levels helps assessing COA reliability.
Traceability: Legitimate COAs include sample identification, injection date/time, instrument parameters, analyst signature. Links specific chromatogram to your product batch. Generic chromatograms without traceability questionable. Batch number on COA must match product label. COA verification essential for quality assurance.
Reading heatmap visualizations
Heatmaps provide visual representation of multiple chromatograms enabling pattern recognition.
Heatmap construction and interpretation
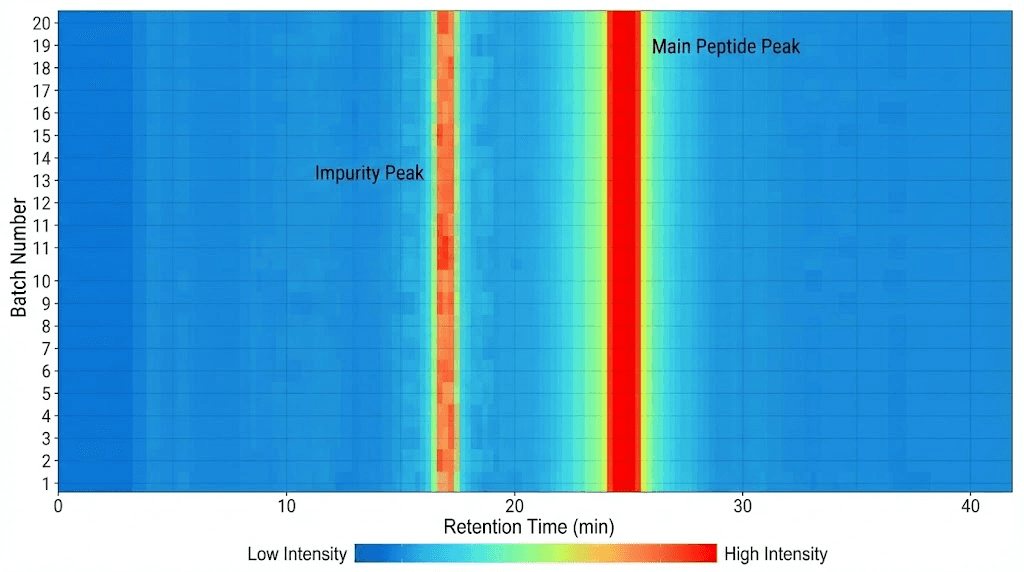
Color-coded intensity: Heatmap displays chromatogram data with X-axis showing retention time, Y-axis showing sample number or injection sequence, and color intensity representing absorbance (peak intensity). Bright colors (red, yellow) indicate high absorbance (peaks), dark colors (blue, black) represent baseline. Allows visualizing many chromatograms simultaneously.
Batch consistency assessment: Comparing multiple samples from same batch should show identical retention time and intensity patterns. All samples displaying main peak at same retention time with similar intensity confirms batch homogeneity. Variations suggest mixing issues, degradation during storage, or sampling errors.
Temporal stability: Analyzing stored peptide at multiple timepoints creates heatmap showing stability. Consistent pattern over weeks/months indicates stable product. Decreasing main peak intensity or appearing degradation peaks reveals instability requiring storage condition optimization.
Sample-to-sample variability: Different batches or vendors shown as separate rows in heatmap. Variations in retention time might indicate different synthesis/purification methods or column differences. Intensity differences suggest concentration variations. Impurity patterns reveal quality consistency across sources.
Quality control monitoring: Production facilities use heatmaps monitoring process consistency. All production runs showing similar chromatographic profiles confirms reproducible synthesis and purification. Outlier runs appearing different trigger investigation. Heatmaps provide at-a-glance quality assessment across large datasets. Batch monitoring essential for vendor reliability.
Identifying patterns and anomalies
Consistent main peak: Vertical line of high intensity (bright color) at specific retention time across all samples indicates consistent peptide elution. Expected pattern for good quality control. Retention time remaining constant confirms same peptide across batches.
Impurity tracking: Small secondary peaks appearing consistently at same retention times across batches suggests systematic impurity (synthesis byproduct not fully removed). Impurities appearing randomly or increasing over time indicates degradation or contamination.
Batch-to-batch differences: Some samples showing different impurity profiles (additional peaks at unusual retention times) suggests variable synthesis quality. Problematic for vendor reliability requiring each batch verification rather than trusting vendor reputation.
Degradation signatures: Main peak intensity decreasing over time (going from bright to dim) with simultaneous appearance or growth of degradation product peaks indicates instability. Guides storage optimization (temperature reduction, oxygen exclusion, light protection).
Retention time shifts: Main peak appearing at slightly different retention times across samples (diagonal pattern on heatmap rather than vertical) might indicate column aging, temperature variations, or different analytical conditions between testing sessions. Minor shifts (<0.5 minutes) acceptable, larger shifts suggest method inconsistency requiring standardization.
Overlay chromatograms vs heatmaps
Traditional overlay plots: Displaying multiple chromatograms on same axes with different colors. Works well for 2-5 samples allowing detailed comparison. Becomes cluttered with many samples limiting usefulness.
Heatmap advantages: Handles dozens to hundreds of chromatograms without visual clutter. Pattern recognition easier than comparing individual overlays. Quickly identifies outliers (samples appearing different from group). Ideal for large-scale quality control or stability studies.
Complementary approaches: Use heatmaps for initial screening identifying interesting samples (outliers, trends). Follow with detailed overlay plots examining specific samples closely. Heatmaps provide big picture, overlays enable detailed analysis. Understanding data visualization methods optimizes analytical workflows.
Software tools for heatmap generation
Chromatography data systems: Modern HPLC software includes heatmap generation tools. Automatically imports multiple chromatogram files creating heatmap visualizations. Allows interactive exploration (clicking heatmap region displays corresponding chromatogram, adjusting color scales enhancing features).
Third-party analytics software: MATLAB, R statistical environment, Python libraries (matplotlib, seaborn) enable custom heatmap creation. Provides flexibility for advanced visualizations and statistical analyses. Requires programming knowledge but powerful for research applications.
Vendor reporting: Some peptide vendors provide heatmaps in COAs showing batch consistency or stability data. Impressive presentation though authenticity requires verification through independent testing. Heatmaps can be faked like any data visualization. Critical evaluation essential regardless of professional appearance.
Common impurity patterns and identification
Recognizing typical impurities aids quality assessment and troubleshooting.
Synthesis-related impurities
Deletion peptides: Missing one or more amino acids from target sequence. Result from incomplete coupling during synthesis (amino acid not fully reacting with growing peptide chain). Typically elute earlier than full-length peptide being less hydrophobic. Multiple deletion variants possible (missing different amino acids) creating multiple impurity peaks.
Truncated sequences: Peptide synthesis stopped prematurely creating shorter sequences. Peptide fragments with varied lengths. Common when synthesis yields drop in later cycles. Appear at various retention times depending on length and sequence composition.
Addition or insertion peptides: Extra amino acid incorporated due to double coupling or side reactions. Elute later than target peptide being more hydrophobic (additional residues increase retention). Less common than deletions but possible especially with problematic amino acids.
Racemization products: D-amino acids incorporated instead of L-amino acids during synthesis or through racemization after synthesis. Diastereomers showing slightly different chromatographic behavior potentially appearing as peak splitting or shoulders on main peak. Significant problem for peptides with multiple stereocenters.
Capping byproducts: Unreacted peptide chains capped (acetylated or otherwise terminated) during synthesis preventing further coupling. Creates truncated sequences with modified N-terminus.
May show different retention based on capping group hydrophobicity.
Protecting group residues: Protecting groups used during synthesis should be removed before final product. Incomplete deprotection leaves protected amino acids creating modified peptides. Typically more hydrophobic than target appearing at later retention times. Understanding peptide synthesis explains impurity origins.
Degradation products
Oxidation: Methionine and cysteine particularly susceptible to oxidation. Methionine oxidized to methionine sulfoxide (adds 16 Da) potentially showing as separate peak or shoulder on main peak. Further oxidation to sulfone possible (adds 32 Da). Tryptophan also oxidation-prone though less common. Usually elute slightly earlier than native peptide due to increased polarity.
Deamidation: Asparagine and glutamine spontaneously deamidating to aspartic acid and glutamic acid especially at elevated pH or temperature. Creates charge change affecting chromatographic behavior. Deamidated peptide typically elutes earlier (more hydrophilic due to additional negative charge).
Hydrolysis: Peptide bonds cleaving (breaking) creating peptide fragments. Aspartic acid bonds particularly labile at low pH. Fragments appear at various retention times depending on size and sequence. Multiple fragments create complex impurity patterns.
Disulfide scrambling: Peptides with multiple cysteine residues forming disulfide bonds can undergo exchange reactions creating non-native disulfide pairing. Each scrambled variant shows unique retention time. Appears as multiple peaks around target peptide retention time.
Aggregation: Peptides self-associating through hydrophobic interactions or disulfide formation. Dimers, trimers, higher-order aggregates possible. May not completely dissociate during analysis appearing at retention times different from monomer. Size-exclusion chromatography better for detecting aggregates than reverse-phase.
Light-induced modifications: Photo-oxidation of aromatic residues (tryptophan, tyrosine) from light exposure. Increases polarity typically causing earlier elution. Prevention through amber vials and dark storage. Impurity pattern indicating storage problems.
Degradation prevention essential for maintaining quality.
Formulation and handling artifacts
Salt peaks: Trifluoroacetate (TFA) counter-ions from purification or acetate/chloride from formulation buffers appearing as early-eluting peaks. High concentration salt manifests as large void volume peak. Normal finding not indicating peptide impurity though excessive salts suggest inadequate desalting.
Excipient peaks: Formulation ingredients (mannitol, trehalose, HSA) if present at high concentration might appear in chromatogram. Usually baseline-separated from peptide peak. Should be documented in COA and not counted toward purity calculation if formulation components intentionally included.
Solvent residues: Residual organic solvents from synthesis or purification (dimethylformamide, dichloromethane, acetonitrile, methanol). Volatile solvents often lost during lyophilization though traces may remain. Appear at characteristic retention times usually well-separated from peptide. Acceptable at low levels, high levels concerning for process control.
Bacterial endotoxins: Lipopolysaccharides from bacterial contamination during non-sterile synthesis or handling. Not detected by standard UV detection requiring specialized assays (LAL test). Good manufacturing practice minimizes endotoxin though research chemicals rarely tested. Separate concern from chromatographic purity.
Extractables from packaging: Plastic vials or rubber stoppers leaching compounds into peptide solution over time. Usually hydrophobic organic compounds appearing at later retention times. More problematic for reconstituted peptides stored long-term than lyophilized powder. Glass vials preferred for long-term storage minimizing extractables.
Comparing theoretical vs actual retention times
Expected retention times guide identity confirmation and anomaly detection.
Predicting retention from peptide sequence
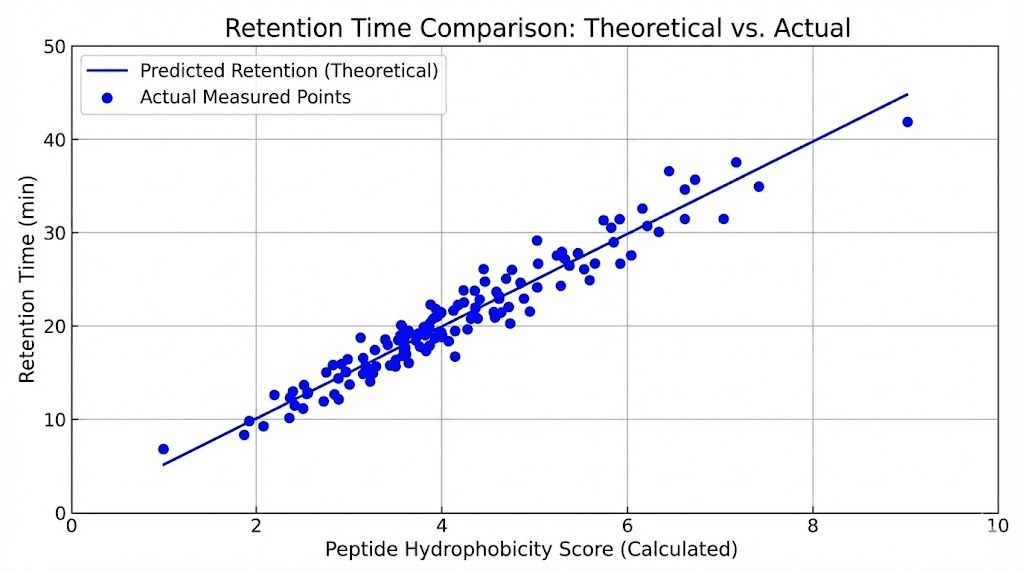
Hydrophobicity calculations: Various algorithms estimate peptide hydrophobicity from sequence summing contributions of individual amino acids. Kyte-Doolittle, Eisenberg, GRAVY scales commonly used. More hydrophobic peptides predicted to elute later in reverse-phase chromatography. Correlation imperfect but generally reliable for gross predictions.
Sequence-specific considerations: Acidic amino acids (Asp, Glu) with negative charge showing different retention than predicted by hydrophobicity alone. Basic amino acids (Lys, Arg, His) similarly affected. Proline disrupting peptide secondary structure potentially affecting retention. N-terminus and C-terminus modifications (acetylation, amidation) alter retention versus unmodified peptide.
Structure impact: Cyclic peptides like BPC-157 showing different retention than linear peptides of similar sequence due to conformational restrictions. Disulfide bonds creating cyclic structures affecting chromatographic behavior. Secondary structure (helices, beta-sheets) potentially impacting column interactions though peptides often unfolded under denaturing HPLC conditions.
Method-dependent variation: Retention time depends on column type (C18, C8, C4), mobile phase composition (TFA concentration, organic solvent type), gradient steepness, temperature, and flow rate. Same peptide shows different retention times on different HPLC systems. Predictions must consider specific method parameters matching conditions used.
Retention time databases: Literature values or previous analyses of same peptide provide most reliable retention time expectations. Vendor COAs from previous batches guide expected retention times for current batch verification. However, method differences between labs require caution extrapolating retention times. Retention time databases compile literature values for common peptides.
Identity confirmation through retention matching
Retention time window: Expected retention time established through reference standard or literature. Sample peak appearing within narrow window (typically ±5% of expected time) consistent with target peptide identity. Peak outside window suggests wrong compound, degraded sample, or method variation.
Insufficient for definitive identification: Retention time matching necessary but not sufficient for identity confirmation. Different peptides might show similar retention times (retention time alone not unique identifier). Mass spectrometry required for definitive identification through molecular weight confirmation.
Complementary with other data: Retention time combined with purity pattern, peak shape, and method suitability results strengthens confidence. All parameters matching expectations suggests correct peptide. Discrepancies warrant investigation potentially including MS analysis.
Batch-to-batch consistency: Legitimate vendors show consistent retention times across batches (analyzed on same instrument and method). Batch-to-batch variations raise concerns about product authenticity or method changes. Retention time tracking over multiple purchases identifies concerning trends.
Troubleshooting retention time anomalies
Column aging: Stationary phase degradation over hundreds to thousands of injections causes gradual retention time changes. C18 chains cleaving or silanol sites exposing altering retention mechanism. Expected phenomenon managed through periodic retention time recalibration or column replacement. Changes gradual (weeks to months) versus sudden shifts indicating acute problems.
Temperature fluctuations: Column temperature affecting retention, higher temperature generally decreasing retention times. Column oven malfunction or environmental temperature changes causing retention time variability. Temperature control essential for reproducible retention. Maintaining ±1°C typical requirement.
Mobile phase variations: Buffer pH drift, acid modifier concentration changes, or water contamination altering mobile phase properties affecting retention. Fresh mobile phase preparation and proper storage minimizes variations. Ion-pairing agent (TFA) concentration particularly critical for peptide retention.
Sample matrix effects: High salt, organic solvent, or detergent concentrations in sample affecting chromatographic behavior. Desalting or diluting sample resolves problems. Retention time for standards (in pure solvent) versus samples (in complex matrix) may differ requiring method optimization.
System problems: Pump malfunction causing inconsistent flow rates or gradient delivery. Air bubbles in system disrupting flow. Column connection problems creating dead volumes. Leak reducing effective flow rate. System troubleshooting required when retention times shift suddenly or behave erratically. HPLC troubleshooting resolves technical issues affecting results.
Evaluating method parameters and quality
Method details reveal analysis reliability and potential manipulation.
Critical method parameters in COAs
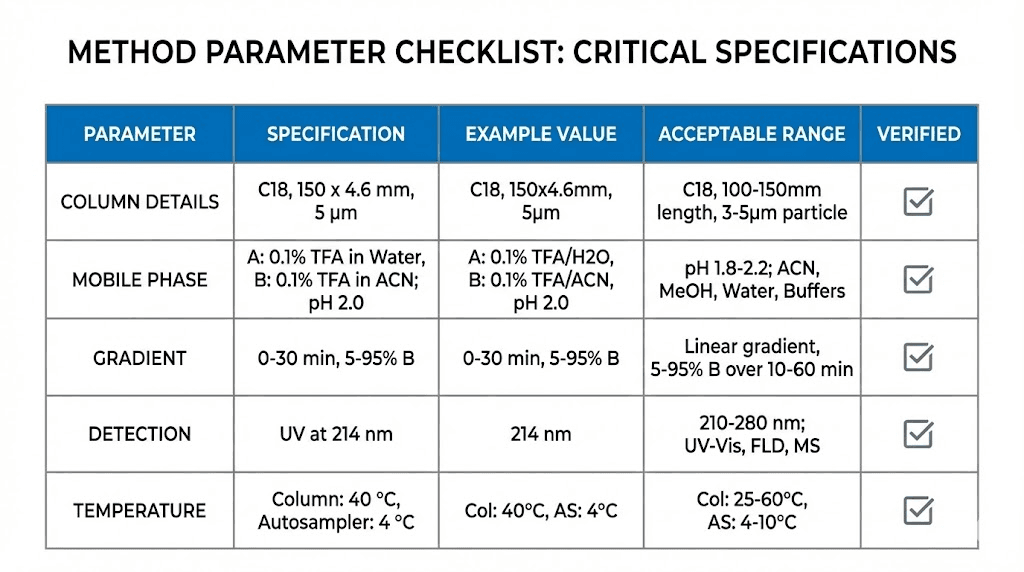
Column specifications: Column brand, length (typically 150-250mm), internal diameter (typically 4.6mm analytical scale), particle size (3-5 micrometer), and stationary phase type (C18 most common). These parameters substantially affect retention times, resolution, and analysis time. Different columns produce different chromatograms even for identical samples.
Mobile phase composition: Detailed description of aqueous phase (water with acid modifier type and concentration) and organic phase (acetonitrile or methanol). Acid modifier typically TFA at 0.05-0.1% creating low pH for peptide chromatography. Some methods use formic acid or phosphoric acid. Mobile phase dramatically affects retention and peak shape.
Gradient program: Starting and ending organic percentages with time course. Typical program: 5% to 95% acetonitrile over 30 minutes (steep gradient for rapid analysis) or 60 minutes (shallow gradient for better resolution). Equilibration time (returning to starting conditions between injections) also specified. Gradient shape (linear, curved, stepped) affects separation.
Flow rate: Milliliters per minute mobile phase flowing through column. Typical 1.0 mL/min for 4.6mm diameter analytical columns. Higher flow rates decrease analysis time but reduce resolution. Lower flow rates improve resolution but extend run time. Affects retention times (higher flow = shorter retention).
Detection parameters: Wavelength (typically 214nm or 220nm for peptides), bandwidth, reference wavelength if used. Some methods monitor multiple wavelengths simultaneously creating UV spectra for peak identification. Detection settings affect sensitivity and selectivity.
Temperature: Column temperature typically 25-40°C controlled by column oven. Higher temperatures decrease retention times and improve peak shapes for some peptides. Temperature specification essential for retention time reproducibility. Uncontrolled room temperature analyses show higher variability.
Injection volume: Amount of sample injected, typically 5-20 microliters. Too large volume causes peak broadening or splitting (volume overload). Too small reduces sensitivity. Volume standardization important for reproducibility. Method development optimizes these parameters for specific peptides.
Red flags in method reporting
Insufficient detail: COA listing "C18 column" and "acetonitrile gradient" without specifics prevents method reproduction or evaluation. Could hide inappropriate method producing artificially high purity or poor separation masking impurities. Legitimate COAs provide complete method details allowing independent verification.
Unusual or unconventional methods: Using ion-pairing agents other than TFA, exotic stationary phases, extreme pH values, or non-standard gradients might indicate method specifically designed to give favorable results versus general applicability. Not necessarily fraudulent but warrants scrutiny.
Method "not specified" or "proprietary": Refusing to disclose method prevents independent verification. Major red flag suggesting vendor hiding something. Legitimate analytical methods not proprietary (general chromatographic principles apply universally). Method secrecy prevents customers confirming vendor claims.
Inconsistent methods between batches: Vendor changing methods between batches complicates batch-to-batch comparison. Could indicate method shopping (trying different conditions until finding one giving high purity numbers). Established vendors use consistent methods demonstrating reproducible quality control.
Method obviously mis-matched to peptide: Using non-polar mobile phase for highly hydrophobic peptide (would never elute) or vice versa. Suggests generic chromatogram not actually matching peptide being sold. Copy-paste COAs from different peptides showing identical chromatograms despite different sequences impossible.
Validating method suitability
System suitability results: Well-designed COAs include system suitability testing confirming HPLC performance before sample analysis. Typical parameters: retention time reproducibility (RSD <2%), peak area reproducibility (RSD <2%), tailing factor (<2.0), theoretical plates (efficiency measure, >2000 per column length). Meeting criteria indicates reliable analysis.
Resolution between peaks: For impurities resolved from main peak, resolution values (Rs) should exceed 1.5 for baseline separation. Insufficient resolution means impurity peak areas incorrectly calculated (peaks overlapping, integration boundaries uncertain). Poor resolution underestimates impurities inflating apparent purity.
Limit of detection and quantitation: Smallest impurity peak reliably detected and quantified. LOD typically 0.05-0.1% (area percentage), LOQ 0.1-0.2%. Methods with high LOD might not detect minor impurities present at <0.5% underestimating total impurity content. Sensitive methods with low LOD provide more complete impurity profile.
Linearity and calibration: For quantitative analysis, calibration curve showing linear detector response across relevant concentration range. Though purity by area percentage doesn't require absolute quantitation, linearity confirms detector not saturating (non-linear response underestimating major peak area potentially inflating impurity percentages).
Blank injections: Mobile phase or solvent injected without peptide shows background signal. Should display flat baseline with no significant peaks. Peaks in blank indicate contamination or carryover from previous injections compromising sample analysis. Clean blanks essential for valid results. Analytical validation ensures result reliability.
Practical COA analysis and red flags
Applying chromatogram reading skills to vendor document evaluation.
Legitimate COA characteristics
Actual chromatogram included: Image showing real analysis with visible peaks, baseline, axes labels, retention times, and integration results. Not just numerical purity claim. Chromatogram provides raw data allowing independent evaluation versus accepting vendor's interpretation.
Batch-specific information: COA explicitly states batch number matching product label. Analysis date should be recent (within months of purchase). Unique identification linking specific analysis to your product. Generic COAs used for multiple batches inadequate.
Laboratory attribution: Laboratory name, address, and contact information. Allows calling lab to verify analysis authenticity. Legitimate third-party labs willing to confirm testing performed and results matching COA. Internal vendor labs acceptable if contact information provided though third-party testing preferred for objectivity.
Method details: Complete description allowing method reproduction. Column specs, mobile phase, gradient, detection wavelength, temperature, flow rate all specified. Sufficient detail for analyst at different facility reproducing analysis.
Integration report: Peak table listing retention times, peak heights, peak areas, and area percentages for all peaks. Shows main peptide plus any impurities detected. Transparency in integration supporting purity calculation.
Proper formatting: Professional appearance with clear organization, appropriate units, logical layout. Scientific notation where appropriate. Tables and figures clearly labeled. While professionalism doesn't guarantee authenticity, lack of basic formatting concerning. Understanding COA authentication protects against fraud.
Common COA red flags
Too perfect results: Purity exactly 99.9% or 100.0% with zero impurities detected. Real analytical results show natural variation (98.7%, 99.2%, etc.). Perfect numbers suggest data fabrication versus actual analysis.
Generic chromatograms: Same chromatogram used for multiple different peptides. Each peptide has unique sequence producing characteristic retention time and impurity profile. Identical chromatograms physically impossible unless same peptide.
Mismatched data: Purity number not matching visible chromatogram peak areas. Claiming 98% purity when chromatogram shows multiple large impurity peaks inconsistent with claim. Requires critical evaluation of peak integration supporting reported purity.
Missing batch numbers: COA without batch identification or batch number not matching product label. Prevents linking COA to your specific product. Could be generic document applied to all batches regardless of actual quality.
No contact information: Laboratory not identified or contact details absent. Prevents verification. Vendor might be using fake laboratory name or providing entirely fabricated documents.
Impossible method parameters: Flow rate, gradient program, or other parameters physically impossible or producing non-sensible results. Suggests COA created without actual analysis. Requires chromatographic knowledge identifying implausible methods.
Refusal to provide: Vendor not providing COA upon request or requiring additional payment for testing results. Legitimate vendors include COA with products or provide upon request. Reluctance suggests absence of testing or poor results being hidden.
Independent verification necessity
Limitations of vendor COAs: Even legitimate-appearing COAs might not represent actual product in your hands. Vendor could selectively test good batches providing COAs while shipping inferior untested batches. Mislabeling, contamination during packaging, or degradation during shipping affects product quality despite initial testing showing acceptable purity.
Third-party testing: Sending sample to independent analytical laboratory (Colmaric Analyticals, Janoshik Analytical, university facilities) provides objective quality verification. Costs $75-$200 per sample but worth expense for expensive protocols or first-time vendor evaluation.
Community testing initiatives: Multiple users pooling funds sending sample for independent analysis. Results shared benefiting entire community. Reduces individual cost while providing vendor verification. Coordinated through Reddit, Discord, or specialized forums. SeekPeptides facilitates community testing programs.
Testing frequency: Ideally test first order from new vendor establishing quality baseline. Periodic retesting (every 6-12 months or every 10-20 vials) ensures continued quality.
Even established vendors experience occasional quality issues. Ongoing vigilance prevents using degraded or contaminated products.
Understanding testing economics balances cost against quality assurance.
How SeekPeptides supports analytical literacy
SeekPeptides provides comprehensive resources for developing chromatogram reading skills and analytical evaluation capabilities.
Detailed HPLC fundamentals explaining separation principles, instrumentation, and method development. Progressive education from basic concepts to advanced interpretation.
Chromatogram interpretation guides with annotated examples showing typical peptide analyses, common impurity patterns, and anomaly identification. Interactive learning through real chromatogram examination.
COA evaluation tools including red flag checklists, verification protocols, and contact information for testing laboratories. Systematic framework for document assessment.
In case I don't see you, good afternoon, good evening, and good night.
May your chromatograms stay clean, your retention times stay consistent, and your peptide purity stay verifiable. Join SeekPeptides.